| xlsgen > overview > Advanced conditional formatting |
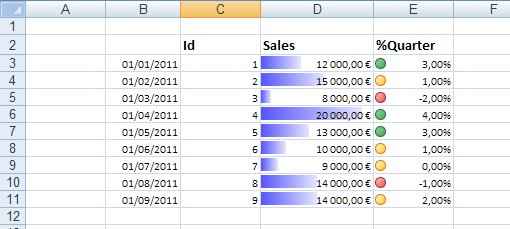
Excel 2007 (XLSX files) introduced advanced conditional formattings in order to facilite the visual analysis of data. xlsgen supports these advanced conditional formattings :
The point of data bars is to a draw bar in the cell background, bar whose width reflects the value : the bigger the bar, the higher the value being reflected. If the value changes, the bar changes as well.
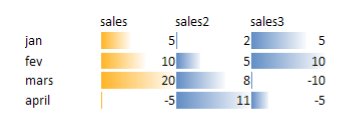
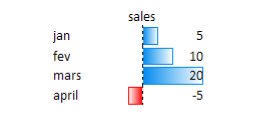
Data bars are applied across a range of cells. And thanks to this, there is an implicit minimum value and an implicit maximum value. The boundaries make it possible to size each bar accordingly.
By default, the minimum and maximum values are calculated. But it is possible to program data bars so that they reflect different values on both ends, such as a percent or even an arbitrary formula. It is exposed by the IXlsDatabarCondition interface.
Databars are rendered so if you are doing a print, preview, PDF or XPS generation, you will see the databars. Advanced databar formatting options introduced in Excel 2010 are rendered. It includes : support for negative values, custom negative color bar, custom border show on/off, custom border color, custom negative border color, custom middle axis show on/off, custom middle axis position, custom middle axis color.
The following source code shows how to create data bars with their default behavior :
| Java code |
XlsRange rng = wksht.NewRange("D3:D11");
XlsConditionalFormatting fmt = rng.NewConditionalFormatting();
XlsDatabarCondition db = fmt.getDatabarCondition();
db.putColor(0xFF0000);
|
| VB code |
Dim rng As xlsgen.IXlsRange
Set rng = wksht.NewRange("D3:D11")
Dim fmt As xlsgen.IXlsConditionalFormatting
Set fmt = rng.NewConditionalFormatting
Dim db As xlsgen.IXlsDatabarCondition
Set db = fmt.DatabarCondition
db.Color = &HFF0000
|
| C# code |
IXlsRange rng = wksht.NewRange("D3:D11");
IXlsConditionalFormatting fmt = rng.NewConditionalFormatting();
IXlsDatabarCondition db = fmt.DatabarCondition;
db.Color = 0xFF0000;
|
| C++ code |
xlsgen::IXlsRangePtr rng = wksht->NewRange(L"D3:D11"); xlsgen::IXlsConditionalFormattingPtr fmt = rng->NewConditionalFormatting(); xlsgen::IXlsDatabarConditionPtr db = fmt->DatabarCondition; db->Color = 0xFF0000; |
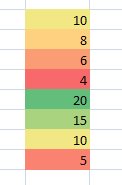
Color scales are a variant of data bars. Instead of a dynamic bar in the background, the visual cue is the color of the entire background of the cell. When applied to a whole range of cells, it implicitely defines minumum and maximum values, and the color scale reflects the variations.
Usually, the ends of the color scales will be green and red, in any order, to reflect status of a changing value. With that said, it is possible to set any color at both ends, it is also possible to define colors in the middle.
Just like data bars by default, the implicit minimum and maximum values will be calculated but the color scales can define other ends, by a percent or even an arbitrary formula. It is exposed by the IXlsColorScaleCondition interface.
The following source code shows how to create color scales :
| Java code |
XlsRange rng = wksht.NewRange("B2:D7");
XlsConditionalFormatting fmt = rng.NewConditionalFormatting();
XlsColorScaleCondition cs = fmt.getColorScaleCondition();
XlsColorScaleSubCondition c1 = cs.Add();
c1.putImplicitValue(true);
c1.putColor(0x00FF0000);
XlsColorScaleSubCondition c2 = cs.Add();
c2.putExplicitValueAsFormula("=10");
c2.putColor(0x0000FF00);
XlsColorScaleSubCondition c3 = cs.Add();
c3.putColor(0x00FFFFFF);
|
| VB code |
Dim rng As IXlsRange
Set rng = wksht.NewRange("B2:D7")
Dim fmt As IXlsConditionalFormatting
Set fmt = rng.NewConditionalFormatting
Dim cs As IXlsColorScaleCondition
Set cs = fmt.ColorScaleCondition
Dim c1 As IXlsColorScaleSubCondition
Set c1 = cs.Add
c1.ImplicitValue = True
c1.Color = &H00FF0000
Dim c2 As IXlsColorScaleSubCondition
Set c2 = cs.Add
c2.ExplicitValueAsFormula = "=10"
c2.Color = &H0000FF00
Dim c3 As IXlsColorScaleSubCondition
Set c3 = cs.Add
c3.Color = &H00FFFFFF
|
| C# code |
IXlsRange rng = wksht.NewRange("B2:D7");
IXlsConditionalFormatting fmt = rng.NewConditionalFormatting();
IXlsColorScaleCondition cs = fmt.ColorScaleCondition;
IXlsColorScaleSubCondition c1 = cs.Add();
c1.ImplicitValue = true;
c1.Color = 0x00FF0000;
IXlsColorScaleSubCondition c2 = cs.Add();
c2.ExplicitValueAsFormula = "=10";
c2.Color = 0x0000FF00;
IXlsColorScaleSubCondition c3 = cs.Add();
c3.Color = 0x00FFFFFF;
|
| C++ code |
xlsgen::IXlsRangePtr rng = wksht->NewRange(L"B2:D7"); xlsgen::IXlsConditionalFormattingPtr fmt = rng->NewConditionalFormatting(); xlsgen::IXlsColorScaleConditionPtr cs = fmt->ColorScaleCondition; xlsgen::IXlsColorScaleSubConditionPtr c1 = cs->Add(); c1->ImplicitValue = TRUE; c1->Color = 0x00FF0000; xlsgen::IXlsColorScaleSubConditionPtr c2 = cs->Add(); c2->ExplicitValueAsFormula = L"=10"; c2->Color = 0x0000FF00; xlsgen::IXlsColorScaleSubConditionPtr c3 = cs->Add(); c3->Color = 0x00FFFFFF; |
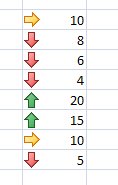
Icon sets are another variant of data bars where instead of a bar in the background of the cell, a symbol is displayed next to the value in the cell. The symbols are meant to reflect a status or a status change, that's why often symbols will be red or green arrows, traffic lights and so on. The programming interface lets pick among the following symbols :
    iconset_3arrows_colored         = 0,
    iconset_3arrows_gray            = 1,
    iconset_3flags                  = 2,
    iconset_3trafficlights_unrimmed = 3,
    iconset_3trafficlights_rimmed   = 4,
    iconset_3signs                  = 5,
    iconset_3symbols_circled        = 6,
    iconset_3symbols_uncircled      = 7,
    iconset_4arrows_colored         = 8,
    iconset_4arrows_gray            = 9,
    iconset_4redtoblack             = 10,
    iconset_4rating                 = 11,
    iconset_4trafficlights          = 12,
    iconset_5arrows_colored         = 13,
    iconset_5arrows_gray            = 14,
    iconset_5rating                 = 15,
    iconset_5quarters               = 16
The symbols are either 3-state, 4-state and 5-state.
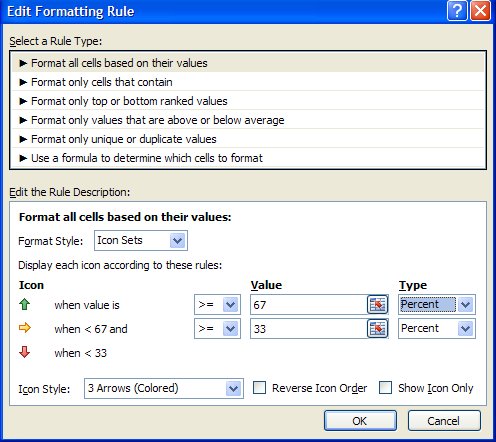
When applied to a range of cells, icon sets will use the implicit minimum, middle and maximum values to pick which symbol to display (3-state), but programmatically it is possible to define custom ends, with a percent, or even with an arbitrary formula. It is exposed by the IXlsIconSetCondition interface.
The following source code shows how to create icon sets :
| Java code |
XlsRange rng = wksht.NewRange("E3:E11");
XlsConditionalFormatting fmt = rng.NewConditionalFormatting();
XlsIconSetConditionPtr cs = fmt.getIconSetCondition();
cs.putIconSet(xlsgen.iconset_3trafficlights_unrimmed);
XlsIconSetSubCondition c1 = cs.Add();
c1.putExplicitPercentAsFormula("=0");
XlsIconSetSubCondition c2 = cs.Add();
c2.putExplicitPercentAsFormula("=33");
XlsIconSetSubCondition c3 = cs.Add();
c3.putExplicitPercentAsFormula("=67");
|
| VB code |
Dim rng As IXlsRange
Set rng = wksht.NewRange("E3:E11")
Dim fmt As IXlsConditionalFormatting
Set fmt = rng.NewConditionalFormatting
Dim cs As IXlsIconSetConditionPtr
Set cs = fmt.IconSetCondition
cs.IconSet = enumIconSet.iconset_3trafficlights_unrimmed
Dim c1 As IXlsIconSetSubCondition
Set c1 = cs.Add
c1.ExplicitPercentAsFormula = "=0"
Dim c2 As IXlsIconSetSubCondition
Set c2 = cs.Add
c2.ExplicitPercentAsFormula = "=33"
Dim c3 As IXlsIconSetSubCondition
Set c3 = cs.Add
c3.ExplicitPercentAsFormula = "=67"
|
| C# code |
IXlsRange rng = wksht.NewRange("E3:E11");
IXlsConditionalFormatting fmt = rng.NewConditionalFormatting();
IXlsIconSetConditionPtr cs = fmt.IconSetCondition;
cs.IconSet = enumIconSet.iconset_3trafficlights_unrimmed;
IXlsIconSetSubCondition c1 = cs.Add();
c1.ExplicitPercentAsFormula = "=0";
IXlsIconSetSubCondition c2 = cs.Add();
c2.ExplicitPercentAsFormula = "=33";
IXlsIconSetSubCondition c3 = cs.Add();
c3.ExplicitPercentAsFormula = "=67";
|
| C++ code |
xlsgen::IXlsRangePtr rng = wksht->NewRange(L"E3:E11"); xlsgen::IXlsConditionalFormattingPtr fmt = rng->NewConditionalFormatting(); xlsgen::IXlsIconSetConditionPtr cs = fmt->IconSetCondition; cs->IconSet = xlsgen::iconset_3trafficlights_unrimmed; xlsgen::IXlsIconSetSubConditionPtr c1 = cs->Add(); c1->ExplicitPercentAsFormula = L"=0"; xlsgen::IXlsIconSetSubConditionPtr c2 = cs->Add(); c2->ExplicitPercentAsFormula = L"=33"; xlsgen::IXlsIconSetSubConditionPtr c3 = cs->Add(); c3->ExplicitPercentAsFormula = L"=67"; |
xlsgen documentation. © ARsT Design all rights reserved.