| xlsgen > overview > Bollinger bands |
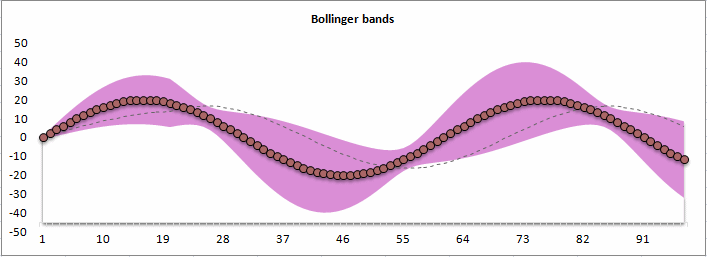
Chart Bollinger bands is a unique chart in xlsgen for visualizing and predicting changes in data. It is a case of financial chart.
Bollinger bands include the following :
Bollinger bands were designed for making decisions according to the signal crossing the bands. Statistically, it is agreed that :
Note that it is also known that bollinger bands being independent of the actual volume (another measure), it may yield inaccurate decision making.
| C++ code |
xlsgen::IXlsChartPtr chart = worksheet->NewChart(xlsgen::charttype_bollingerbands, 4, 3, 18, 8); xlsgen::IXlsChartDynamicDataSourceSeriesPtr serie001 = chart->DynamicDataSource->AddSerie(); serie001->SeriesValuesFormula = L"Sheet1!$C$3:$C$99"; |
xlsgen documentation. © ARsT Design all rights reserved.