| xlsgen > overview > Chart plot area |

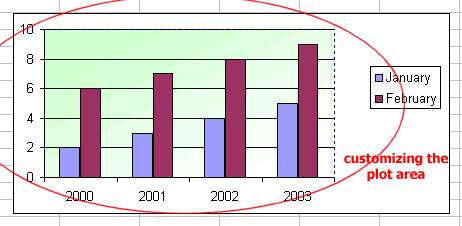
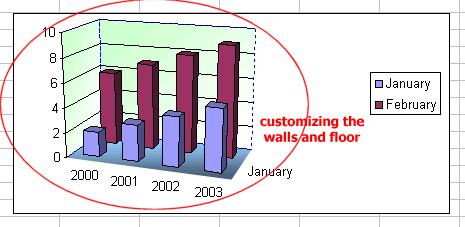
A plot area is the rectangular area where all series are drawn. It is displayed by default and has a grey background color as well as a black border line. When the chart type becomes a 3D chart, the plot area is replaced by walls and floor objects. Both of which are customizable with appropriate interfaces.
The plot area object is accessed from the PlotArea property of the IXlsChart interface. Its interface is described here.
The plot area differs to the surface area in that the plot area covers the portion of the surface area where series are drawn. The surface area represents the entire chart area including the borders.
The plot area and surface area implement common options. The plot area can be moved and resized.

Whenever the chart is a 3D chart, whether interlaced series (3D) or side-by-side series (XYZ), the plot area becomes meaningless and is traded for a combination of walls and floor accessed using the Walls and Floor properties of the IXlsChart3DPanel interface, itself accessed thanks to the ThreeDeePanel property of the IXlsChart interface. Just like the plot area, walls and floor implement common options.
xlsgen documentation. © ARsT Design all rights reserved.