 |
| xlsgen > overview > Chart series |
 |

Customizing the chart series
The chart series object is like the corner stone of chart formatting. There is a great likelihood that no matter what you'd like to achieve you end up using those interfaces.
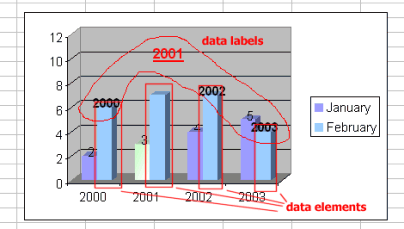
Accessing a particular series lets you make changes limited to that particular series. Furthermore, this object provides an interface to individual data labels and data elements which gets as granular as one can think.
Here is a recap of what's available from this object :
- access to a given series by index or by name, using the
SeriesByIndex (beginning at 1) and SeriesByName properties of the chart interface.
- common options to be applied to all data elements of the series
- axis selection. Whether the series should be "attached" to the primary or secondary axis.
- series type. That's how you can switch this series alone into a line instead of a bar, for instance.
- access to data labels, which are the floating values.
- access to data elements, which are the geometric shapes representing a value.
- access to custom properties, which are properties whose value mean something depending on the chart type, or series type.
- ability to create (or hide) a trendline.
- ability to create (or hide) an error bar. For scatter and bubble charts, error bars can be created on both the X and Y directions, while for all other chart types, only the Y direction is meaningful.
- access to the legend entry associated to this series.
- access to actual values and labels that make up the series (
ActualValues such as ={6;7;7;4} and ActualLabels such as ={"2000";"2001";"2002";"2003"})
Code samples related to charts make an extensive use of those interfaces, especially sample code chart_custom_options.
xlsgen documentation. © ARsT Design all rights reserved.
