| xlsgen > overview > Sparklines |

Sparklines are dense graphics that cannot be achieved using Excel's own chart engine.
More than visuals, sparklines were democratized by Edward Tufte to meet a real need, such as stock tracking.
So sparklines are dense, dynamic, have a ton of built-in features and provide the data you need, when you need it. For instance, the background behind the line charts above is not some random background. It's a normal range. The mathematical definition of normal ranges is : this is the range where 95% of values are. Normal ranges are used in fields such as healthcare where the 5% odd values are usually filtered out.
Another interesting feature of sparklines is that there is a sliding window of data being visualized at any moment. It's not like regular charts (as in Excel charts) where, out of desperation, users creating charts generally include all their data into series, making it very hard to understand, figure out, not to mention see a trend in it. Sparklines thus visualize moving portions of data, and can also store data between sessions, enabling continuous tracking.
Sparklines are built in xlsgen on top of the visual component infrastructure, the building block that runs arbitrary ActiveX controls, allowing to tie their parameters with Excel formulas.
The sparklines ActiveX control installed with xlsgen includes two chart types : lines and bars. What makes the lines type special is the computation and display of the normal range. What makes the bars type special is the calculated or manually set threshold that in turn separates up bars from down bars.
Sparklines include a number of visual cues about the data. By default lines type include a differentiating color for the minimum value, the maximum value and the last value of the data stream. Meanwhile bars type include by default differentiating colors for positive bars, negative bars, the minimum and the maximum. Each of these colors is programmable. And can also be switched off by passing -1 as color value.
The data is actually processed as a data stream. You can pass any number of input points (floating-point values), and the sparklines will always show a "window" of the last points added. That alone really differentiates sparklines from regular Excel charts, where the definition of data series is usually static, and shown in full extent. In addition, by passing a store name, input points are automatically saved in a local file, and then reused across sessions. That is perfect for real-time data analysis such as stock tracking.
By default, the last value of the data is displayed on the right of the sparklines. An optional title can be added to it. It is possible to hide the value and title.
The width between values, called the spacing, can be customized, allowing to set the density of data.
| Property name | Description |
GetType() As Long | |
SetType(Long) | sets the sparklines type. Default is 'lines' (0). 'Bars' is (1). |
GetColorMinValue() As Long | |
SetColorMinValue(Long) | sets the 24-bit RGB color of the minimum value. Pass -1 to hide the minimum value. |
GetColorMaxValue() As Long | |
SetColorMaxValue(Long) | sets the 24-bit RGB color of the maximum value. Pass -1 to hide the maximum value. |
GetColorFirstValue() As Long | |
SetColorFirstValue(Long) | sets the 24-bit RGB color of the first value. Pass -1 to hide the first value. |
GetColorLastValue() As Long | |
SetColorLastValue(Long) | sets the 24-bit RGB color of the last value. Pass -1 to hide the last value. |
GetColorOfPlotValue() As Long | |
SetColorOfPlotValue(Long) | sets the 24-bit RGB color of the value. |
GetColorOfNormalRange() As Long | |
SetColorOfNormalRange(Long) | sets the 24-bit RGB color of the normal range behind the plot. The normal range is 95% of values. Pass -1 to hide the normal range. |
GetSpacing() As Long | |
SetSpacing(Long) | sets the value to display. Default is 2 pixels. |
GetValue() As Double | |
SetValue(Double) | sets the latest value to display. |
GetShowValue() As Boolean | |
SetShowValue(Boolean) | sets whether or not the numeric value is to be displayed on the right side. Default is yes. |
GetTitle() As String | |
SetTitle(String) | sets the optional title to display. |
GetColorPositiveBars() As Long | |
SetColorPositiveBars(Long) | sets the 24-bit RGB color of the positive bars, bars above the threshold. Default value is black. |
GetColorNegativeBars() As Long | |
SetColorNegativeBars(Long) | sets the 24-bit RGB color of the negative bars, bars below the threshold. Default value is black. |
GetThresholdForBars() As Double | |
SetThresholdForBars(Double) | sets the value that sets apart the positive bars from the negative bars. Default value is 0. |
GetStore() As String | |
SetStore(String) | sets the name of the store where the data is automatically saved/loaded. |
Lines include a normal range, which can be hidden, representing 95% of values of the data (more accurately, the slice of data fitting the window).
Positive bars are bars above a threshold. Negative bars are bars below a threshold. By default, the threshold is automatically calculated. The threshold can be manually set to conveniently focus on the region of interest.
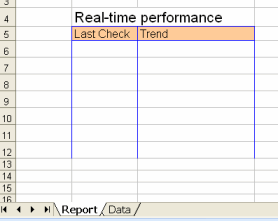
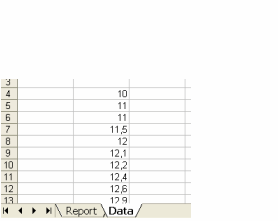
In the examples below, we start from a spreadsheet with the following structure :
 a template spreadsheet for sparklines |
 |
| VB code |
Dim engine As CoXlsEngine
Set engine = CreateObject("ExcelGenerator.ARsTDesign")

Dim wbk As IXlsWorkbook
Set wbk = engine.Open("template.xls", "sparklines.xls")

Dim wksht As IXlsWorksheet
Set wksht = wbk.WorksheetByName("Report")
Dim data As IXlsWorksheet
Set data = wbk.WorksheetByName("Data")

wbk.StyleOption = enumStyleOption.styleoption_preserve


' sparklines of type Lines based on Data (rows 4-40)

' row1,col1, row2,col2, topoffset,leftoffset,bottomoffset,rightoffset
Dim comp As IXlsVisualComponent
Set comp = wksht.NewVisualComponent("Sparklines.ARsTdesign.1", _
                       6, 3, 6, 3, 2, 2, 2, 2)

comp.ParameterByName("SetStore").Formula = "=" & Chr(34) & "s1" & Chr(34)

Dim col As Integer
col = 2

Dim r As Integer


For r = 4 To 40

    Dim szCell As String
    szCell = "=Data!R" & r & "C" & col

    comp.ParameterByName("SetValue").Formula = szCell

Next

wksht.Float(6, 2) = data.Float(r - 1, col)


' sparklines of type Lines (using the store to follow up), (rows 41-44)

' row1,col1, row2,col2, topoffset,leftoffset,bottomoffset,rightoffset
Dim comp2 As IXlsVisualComponent
Set comp2 = wksht.NewVisualComponent("Sparklines.ARsTdesign.1", _
                       7, 3, 7, 3, 2, 2, 2, 2)

comp2.ParameterByName("SetStore").Formula = "=" & Chr(34) & "s1" & Chr(34)

For r = 41 To 44

    Dim szCell2 As String
    szCell2 = "=Data!R" & r & "C" & col

    comp2.ParameterByName("SetValue").Formula = szCell2

Next

wksht.Float(7, 2) = data.Float(r - 1, col)


' sparklines of type Bars

Dim comp3 As IXlsVisualComponent
Set comp3 = wksht.NewVisualComponent("Sparklines.ARsTdesign.1", _
                       8, 3, 8, 3, 0, 0, 0, 0)

comp3.ParameterByName("SetType").Formula = "=1" ' bars
comp3.ParameterByName("SetThresholdForBars").Formula = "=10" ' threshold bars
comp3.ParameterByName("SetTitle").Formula = "=" & Chr(34) & "(base : 10)" & Chr(34)
comp3.ParameterByName("SetSpacing").Formula = "=4"

For r = 4 To 40

    Dim szCell3 As String
    szCell3 = "=Data!R" & r & "C" & col

    comp3.ParameterByName("SetValue").Formula = szCell3

Next

wksht.Float(8, 2) = data.Float(r - 1, col)

wbk.Close
|
| C# code |
CoXlsEngine engine = new CoXlsEngine();

IXlsWorkbook wbk = engine.Open("template.xls", "sparklines.xls");

IXlsWorksheet wksht = wbk.get_WorksheetByName("Report");
IXlsWorksheet data  = wbk.get_WorksheetByName("Data");

wbk.StyleOption = enumStyleOption.styleoption_preserve;


// sparklines of type Lines based on Data (rows 4-40)

// row1,col1, row2,col2, topoffset,leftoffset,bottomoffset,rightoffset
IXlsVisualComponent comp = wksht.NewVisualComponent("Sparklines.ARsTdesign.1",
                       6, 3, 6,3, 2,2,2,2);

comp.get_ParameterByName("SetStore").Formula = "=\"s1\"";

int col = 2;
int r;

for (r = 4; r <= 40; r++)
{
    String szCell = String.Format("=Data!R{0}C{1}", r, col);

    comp.get_ParameterByName("SetValue").Formula = szCell;
}

wksht.set_Float(6,2, data.get_Float(r - 1, col));


// sparklines of type Lines (using the store to follow up), (rows 41-44)

// row1,col1, row2,col2, topoffset,leftoffset,bottomoffset,rightoffset
IXlsVisualComponent comp2 = wksht.NewVisualComponent("Sparklines.ARsTdesign.1",
                       7, 3, 7,3, 2,2,2,2);

comp2.get_ParameterByName("SetStore").Formula = "=\"s1\"";

for (r = 41; r <= 44; r++)
{
    String szCell = String.Format("=Data!R{0}C{1}", r, col);

    comp2.get_ParameterByName("SetValue").Formula = szCell;
}

wksht.set_Float(7,2, data.get_Float(r - 1, col));


// sparklines of type Bars

IXlsVisualComponent comp3 = wksht.NewVisualComponent("Sparklines.ARsTdesign.1",
                       8,3, 8,3, 0,0,0,0);

comp3.get_ParameterByName("SetType").Formula = "=1"; // bars
comp3.get_ParameterByName("SetThresholdForBars").Formula = "=10"; // threshold bars
comp3.get_ParameterByName("SetTitle").Formula = "=\"(base : 10)\"";
comp3.get_ParameterByName("SetSpacing").Formula = "=4";

for (r = 4; r <= 40; r++)
{
    String szCell = String.Format("=Data!R{0}C{1}", r, col);

    comp3.get_ParameterByName("SetValue").Formula = szCell;
}

wksht.set_Float(8,2, data.get_Float(r - 1, col));

wbk.Close();
|
| C/C++ code |
xlsgen::IXlsEnginePtr engine( __uuidof(xlsgen::CoXlsEngine) );

xlsgen::IXlsWorkbookPtr wbk;
wbk = engine->Open( L"template.xls", L"sparklines.xls" );

xlsgen::IXlsWorksheetPtr wksht = wbk->WorksheetByName[L"Report"];
xlsgen::IXlsWorksheetPtr data = wbk->WorksheetByName[L"Data"];

wbk->StyleOption = xlsgen::styleoption_preserve;


// sparklines of type Lines based on Data (rows 4-40)

// row1,col1, row2,col2, topoffset,leftoffset,bottomoffset,rightoffset
xlsgen::IXlsVisualComponentPtr comp = wksht->NewVisualComponent(L"Sparklines.ARsTdesign.1",
                       6, 3, 6,3, 2,2,2,2);

comp->ParameterByName[L"SetStore"]->Formula = L"=\"s1\"";

int col = 2;

for (int r = 4; r <= 40; r++)
{
    WCHAR szCell[128];
    swprintf(szCell, L"=Data!R%dC%d", r, col);

    comp->ParameterByName[L"SetValue"]->Formula = szCell;
}

wksht->Float[6][2] = data->Float[r - 1][col];


// sparklines of type Lines (using the store to follow up), (rows 41-44)

// row1,col1, row2,col2, topoffset,leftoffset,bottomoffset,rightoffset
xlsgen::IXlsVisualComponentPtr comp2 = wksht->NewVisualComponent(L"Sparklines.ARsTdesign.1",
                       7, 3, 7,3, 2,2,2,2);

comp2->ParameterByName[L"SetStore"]->Formula = L"=\"s1\"";

for (int r = 41; r <= 44; r++)
{
    WCHAR szCell[128];
    swprintf(szCell, L"=Data!R%dC%d", r, col);

    comp2->ParameterByName[L"SetValue"]->Formula = szCell;
}

wksht->Float[7][2] = data->Float[r - 1][col];


// sparklines of type Bars

xlsgen::IXlsVisualComponentPtr comp3 = wksht->NewVisualComponent(L"Sparklines.ARsTdesign.1",
                       9,3, 9,3, 0,0,0,0);

comp3->ParameterByName[L"SetType"]->Formula = L"=1"; // bars
comp3->ParameterByName[L"SetThresholdForBars"]->Formula = L"=10"; // threshold bars
comp3->ParameterByName[L"SetTitle"]->Formula = L"=\"(base : 10)\"";
comp3->ParameterByName[L"SetSpacing"]->Formula = L"=4";

for (int r = 4; r <= 40; r++)
{
    WCHAR szCell[128];
    swprintf(szCell, L"=Data!R%dC%d", r, col);

    comp3->ParameterByName[L"SetValue"]->Formula = szCell;
}

wksht->Float[8][2] = data->Float[r - 1][col];


wbk->Close();
|
Note : in the source code above, the Formula property accepts any Excel formula (cell references, functions, ...), not only constant values.
This section explains how it is possible to use xlsgen as part of an automated scenario that creates sparklines in real-time.
Sparklines are regular ActiveX controls instantiated by xlsgen using its visual component infrastructure. This allows to instantiate then create a snapshot of any ActiveX control whose parameters have been bound to Excel formulas. Because the result of such process is a set of pictures, the picture programming interfaces in xlsgen can be used to update sparklines seamlessly in an Excel spreadsheet. Here is how.
Let's assume a sparklines is created, instantiated and the corresponding snapshot is inserted in cell B3 of a spreadsheet. What we want to do, in order to update the sparklines with new data, is to delete the snapshot first, and then re-run the code instantiating the sparklines. The corresponding source code for that is as follows :
| VB code |
' instantiate sparklines
...

' delete the existing sparklines
For i = wksht.Shapes.Count To 1 Step -1
  Dim shape As IXlsShape
  Set shape = wksht.Shapes.Item(i)
  if (shape.LeftColumn == 2)
    shape.Delete
Next

' instantiate sparklines
...
|
| C# code |
// instantiate sparklines
...

// delete the existing sparklines
for (long i = wksht.Shapes.Count; i >= 1; i--)
{
  IXlsShape shape = wksht.Shapes.get_Item(i);
  if (shape.LeftColumn == 2)
    shape.Delete();
}

// instantiate sparklines
...
|
| C/C++ code |
// instantiate sparklines
...

// delete the existing sparklines
for (long i = wksht->Shapes->Count; i >= 1; i--)
{
  xlsgen::IXlsShapePtr shape = wksht->Shapes->Item[i];
  if (shape->LeftColumn == 2)
    shape->Delete();
}

// instantiate sparklines
...
|
xlsgen documentation. © ARsT Design all rights reserved.