| xlsgen > overview > Table subtotals |
An additional xlsgen business intelligence feature is the support for subtotals, that is the ability to aggregate data along a numeric axis and accordingly to table breaks. The aggregate function lets one customize the process. Among the functions are :
| function | description |
| sum | adds each value along the axis |
| min | computes the minimum value along the axis |
| max | computes the maximum value along the axis |
| average | computes the arithmetic mean value along the axis |
| count | computes how many values along the axis |
| diff | computes differences between break groups (example : year over year differences) |
| diffp | computes differences in % between break groups (example : year over year differences) |
The capabilities are exposed in the IXlsTableSubtotals interface.
Breaks must be created prior adding one or more subtotals.
There can be more than one subtotal along a given axis. For instance, one can compute the minimum and maximum along an axis.
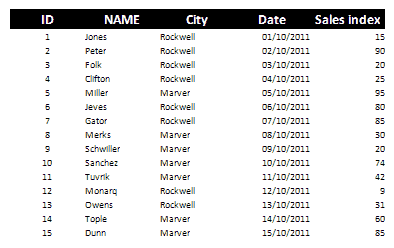
Here is the raw data we are working with :

We are willing to know what are the minimum and maximum values of the sales index according to each city. It's very simple to obtain it :
| Java code |
worksheet.getTables().InferFromWorksheet();

XlsTableBreaks pb = worksheet.getTables().getItem(1).getDataResults().getColumns().getItemByName("City").getBreaks();
pb.DistinctValues();

XlsTableColumn tcSales = worksheet.getTables().getItem(1).getDataResults().getColumns().getItemByName("Sales index");

XlsTableSubtotal sts = pb.getSubtotals().Add(tcSales);
sts.putBuiltinFunction(xlsgen.subtotalfunc_min);
sts.putLabel("min = ");

XlsTableSubtotal stm = pb.getSubtotals().Add(tcSales);
stm.putBuiltinFunction(xlsgen.subtotalfunc_max);
stm.putLabel("max = ");

pb.Apply();
|
| VB code |
worksheet.Tables.InferFromWorksheet()

Dim pb As IXlsTableBreaks
Set pb = worksheet.Tables.Item(1).DataResults.Columns.ItemByName("City").Breaks
pb.DistinctValues

Dim tcSales As IXlsTableColumn
Set tcSales = worksheet.Tables.Item(1).DataResults.Columns.ItemByName("Sales index")

Dim sts As IXlsTableSubtotal
Set sts = pb.Subtotals.Add(tcSales)
sts.BuiltinFunction = xlsgen.enumSubtotalFunction.subtotalfunc_min
sts.Label = "min = "

Dim stm As IXlsTableSubtotal
Set stm = pb.Subtotals.Add(tcSales)
stm.BuiltinFunction = xlsgen.enumSubtotalFunction.subtotalfunc_max
stm.Label = "max = "

pb.Apply
|
| C# code |
worksheet.Tables.InferFromWorksheet();

IXlsTableBreaks pb = worksheet.Tables.get_Item(1).DataResults.Columns.get_ItemByName("City").Breaks;
pb.DistinctValues();

IXlsTableColumn tcSales = worksheet.Tables.get_Item(1).DataResults.Columns.get_ItemByName("Sales index");

IXlsTableSubtotal sts = pb.Subtotals.Add(tcSales);
sts.BuiltinFunction = enumSubtotalFunction.subtotalfunc_min;
sts.Label = "min = ";

IXlsTableSubtotal stm = pb.Subtotals.Add(tcSales);
stm.BuiltinFunction = enumSubtotalFunction.subtotalfunc_max;
stm.Label = "max = ";

pb.Apply();
|
| C/C++ code |
worksheet->Tables->InferFromWorksheet(); IXlsTableBreaks pb = worksheet->Tables->Item[1]->DataResults->Columns->ItemByName[L"City"]->Breaks; pb->DistinctValues(); IXlsTableColumn tcSales = worksheet->Tables->Item[1]->DataResults->Columns->ItemByName[L"Sales index"]; IXlsTableSubtotal sts = pb->Subtotals->Add(tcSales); sts->BuiltinFunction = xlsgen::subtotalfunc_min; sts->Label = L"min = "; IXlsTableSubtotal stm = pb->Subtotals->Add(tcSales); stm->BuiltinFunction = xlsgen::subtotalfunc_max; stm->Label = L"max = "; pb.Apply(): |
And the following result is obtained :

Internally, xlsgen does build actual Excel formulas, computes them and put their results in cells in the footer of each break.
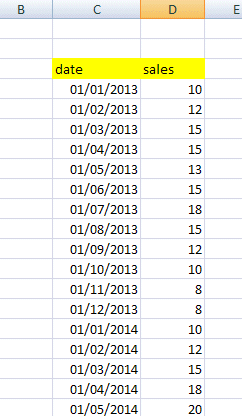
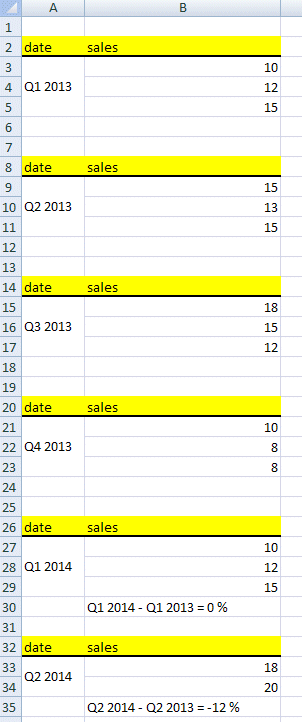
xlsgen can compute financial reports involving year-over-year differences, for instances across quarters. This can be done without much configuration.


And below is the corresponding source code in full :
| Java code |
XlsWorksheet wksht = workbook.getWorksheetByIndex(1);

// automatically infer the data structure (data types, headers, ...)

wksht.getTables().InferFromWorksheet();

// break time data by quarter

XlsTableColumn tcDates = wksht.getTables().getItem(1).getDataResults().getColumns().getItemByName("date");

tcDates.getMap().TimeSeries(xlsgen.formulalanguage_en, xlsgen.timeseries_quarters, true);

XlsTableBreaks pb = tcDates.getBreaks();
pb.DistinctValues();

// year-over-year differences (eg. Q2 2013 compared to Q2 2012)

XlsTableColumn tcSales = wksht.getTables().getItem(1).getDataResults().getColumns().getItemByName("Sales");

XlsTableSubtotal st = pb.getSubtotals().Add(tcSales);
st.putBuiltinFunction(xlsgen.subtotalfunc_diffp);

pb.Apply();

// group by

tcDates.putGroupBy(xlsgen.groupby_showmergedcells);

// insert the financial report

XlsWorksheet wksht_yoy = workbook.AddWorksheet("Year over year");

wksht_yoy.InsertTableAt(wksht.getTables().getItem(1), 2, 1);
|
| VB code |
Dim wksht As IXlsWorksheet
Set wksht = workbook.WorksheetByIndex(1)

' automatically infer the data structure (data types, headers, ...)

wksht.Tables.InferFromWorksheet

' break time data by quarter

Dim tcDates As IXlsTableColumn
Set tcDates = wksht.Tables.Item(1).DataResults.Columns.ItemByName("date")

tcDates.Map.TimeSeries(enumFormulaLanguage.formulalanguage_en, enumMapTimeSeries.timeseries_quarters, True)

Dim pb As IXlsTableBreaks
Set pb = tcDates.Breaks
pb.DistinctValues

' year-over-year differences (eg. Q2 2013 compared to Q2 2012)

Dim tcSales As IXlsTableColumn
Set tcSales = wksht.Tables.Item(1).DataResults.Columns.ItemByName("Sales")

Dim st As IXlsTableSubtotal
Set st = pb.Subtotals.Add(tcSales)
st.BuiltinFunction = enumSubtotalFunction.subtotalfunc_diffp

pb.Apply

' group by

tcDates.GroupBy(enumGroupBy.groupby_showmergedcells)

' insert the financial report

Dim wksht_yoy As IXlsWorksheet
Set wksht_yoy = workbook.AddWorksheet("Year over year")

wksht_yoy.InsertTableAt(wksht.Tables.Item(1), 2, 1)
|
| C# code |
IXlsWorksheet wksht = workbook.get_WorksheetByIndex(1);

// automatically infer the data structure (data types, headers, ...)

wksht.Tables.InferFromWorksheet();

// break time data by quarter

IXlsTableColumn tcDates = wksht.Tables.get_Item(1).DataResults.Columns.get_ItemByName("date");

tcDates.Map.TimeSeries(enumFormulaLanguage.formulalanguage_en, enumMapTimeSeries.timeseries_quarters, true);

IXlsTableBreaks pb = tcDates.Breaks;
pb.DistinctValues();

// year-over-year differences (eg. Q2 2013 compared to Q2 2012)

IXlsTableColumn tcSales = wksht.Tables.get_Item(1).DataResults.Columns.get_ItemByName("Sales");

IXlsTableSubtotal st = pb.Subtotals.Add(tcSales);
st.BuiltinFunction = enumSubtotalFunction.subtotalfunc_diffp;

pb.Apply();

// group by

tcDates.GroupBy(enumGroupBy.groupby_showmergedcells);

// insert the financial report

IXlsWorksheet wksht_yoy = workbook.AddWorksheet("Year over year");

wksht_yoy.InsertTableAt(wksht.Tables.get_Item(1), 2, 1);
|
| C/C++ code |
xlsgen::IXlsWorksheetPtr wksht = workbook->WorksheetByIndex[1]; // automatically infer the data structure (data types, headers, ...) wksht->Tables->InferFromWorksheet(); // break time data by quarter xlsgen::IXlsTableColumnPtr tcDates = wksht->Tables->Item[1]->DataResults->Columns->ItemByName[L"date"]; tcDates->Map->TimeSeries(xlsgen::formulalanguage_en, xlsgen::timeseries_quarters, TRUE); xlsgen::IXlsTableBreaksPtr pb = tcDates->Breaks; pb->DistinctValues(); // year-over-year differences (eg. Q2 2013 compared to Q2 2012) xlsgen::IXlsTableColumnPtr tcSales = wksht->Tables->Item[1]->DataResults->Columns->ItemByName[L"Sales"]; xlsgen::IXlsTableSubtotalPtr st = pb->Subtotals->Add(tcSales); st->BuiltinFunction = xlsgen::subtotalfunc_diffp; pb->Apply(); // group by tcDates->GroupBy(xlsgen::groupby_showmergedcells); // insert the financial report xlsgen::IXlsWorksheetPtr wksht_yoy = workbook->AddWorksheet(L"Year over year"); wksht_yoy->InsertTableAt(wksht->Tables->Item[1], 2, 1); |
xlsgen documentation. © ARsT Design all rights reserved.