xlsgen 4.0.0.92 : Fix for pivot tablesBuild 4.0.0.92 of xlsgen fixes a problem related to pivot tables. A new method is introduced in order to make it possible to aggregate data in rows instead of columns (which was and still is by default). This is a method and not a simple boolean property because the client application can choose the position of this aggregate data in rows, or in columns, as the display follows the order of pivot fields in each of the 4 quadrants (Rows, Columns, Data, Page). Here is how to aggregate data in rows : pivottable.Rows.AddDataFields(); | |
xlsgen 4.0.0.91 : Local scope in named rangesBuild 4.0.0.91 of xlsgen adds support for creating named ranges with restricted scopes, by which is meant restricted to a single worksheet instead of all worksheets. Local scope allows to have non-unique names in each worksheet, facilitating their use. By default any new named range has a workbook scope. Here is how to make one local to a single worksheet (C++) : xlsgen::IXlsWorkbookPtr workbook = engine->New( L"local_namedranges.xlsx" ); | |
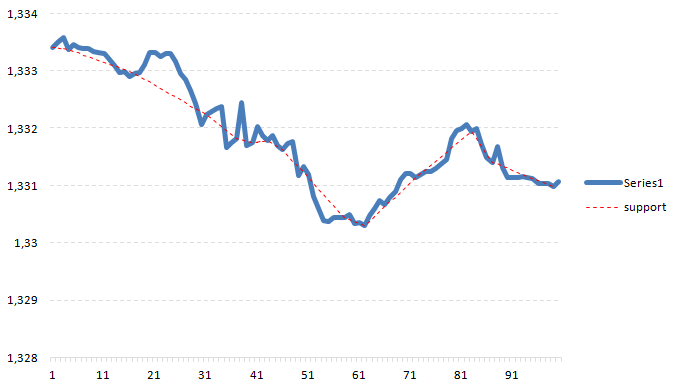
xlsgen 4.0.0.90 : Resistance trendlineBuild 4.0.0.90 of xlsgen brings supports to resistance trendlines, for financial decision making. Support and resistance trendlines are used in stock trading to delimit peer pressure for, respectively, selling and buying stocks. Any time the stock data crosses the support line or the resistance line, this acts as a trade signal. Support and resistance play an opposite role. The support line marks the signal for selling stocks, or for shorting stocks (i.e. buying on the prediction that stocks will go lower). The resistance line marks the signal for buying stocks, or for longing stocks (i.e. buying on the prediction that stocks will go higher).  Support and Resistance trend lines in xlsgen xlsgen completely hides the underlying complexity of calculating support and resistance trendlines. Those lines are calculated based on 10-period smoothed data and the calculation of local minimum and maximum spots which are then interpolated together.
| |||
xlsgen 4.0.0.89 : Support trendlineBuild 4.0.0.89 of xlsgen adds support trendlines to financial analysis tooling. Support trendlines are used in stock trading to delimit peer pressure for selling stocks. Any time the stock data crosses the support line, this acts as a trade signal. The support line marks the signal for selling stocks, or for shorting stocks (i.e. buying on the prediction that stocks will go lower).  Support trend lines in xlsgen | |
xlsgen 4.0.0.88 : New financial chart : MACDBuild 4.0.0.88 of xlsgen adds support for the MACD chart. The MACD chart (short for Moving average convergence divergence) is a trend chart often used for stock trading. It is made of two lines and one bar. Wikipedia article.  MACD (the input data is in blue, everything else is the MACD) The first line is the signal line and is a two pass filter. Its scale is represented on the secondary Y axis. The second line, the average line, is a low pass filter of the signal line. And finally the bar chart is the difference between the two. Both are attached to the secondary Y axis. Interpretation for trading :
| |||
xlsgen 4.0.0.87 : Exponential moving average trendlineBuild 4.0.0.87 of xlsgen adds support for the exponential moving average trendline. The exponential moving average, as the name suggests, is an exponentially decreasing moving average which means recent data in the moving window has more weight than older data. The exponential moving average is closer visually to the series data than the regular moving average and reveals trends like the moving average. It can improve the decision based on the trend analysis.  Exponential moving average (N=20 values in the data window) versus moving average Creating the trendline is straight forward :
| |||
xlsgen 4.0.0.86 : Moving median trendlineBuild 4.0.0.86 of xlsgen adds a new trend line to the list of existing trend lines : moving median.  Moving median (N=5 values in the data window) The moving median, as the name suggests, builds on a median computed inside a moving data window (subset of the series of data). The series of the median values as the window moves makes the trend line. The median is a measure by which half of the data is below it, and the other half is above it. Wikipedia article. Compared to a moving average, the moving median reflects a lot less brutal changes, which are sometimes viewed, depending on the business using it, as skewed or useless values. And here is how to create it :
| |||
xlsgen 4.0.0.85 : Mutiple trendlinesBuild 4.0.0.85 of xlsgen makes it possible to add more than one trendline to a series of data. Before this build, for 3 series of data there could be at most 3 trendlines attached to them, so up to 6 lines in total.  One series of data and 4 trendlines attached to it (moving averages with different parameters) This works for XLS and XLSX/XLSB files. And here is how to code it :
| |
xlsgen 4.0.0.84 : Fix pack for chartsBuild 4.0.0.84 of xlsgen is a fix pack for improving the rendering of charts and other objects. The improvements include : - charts : support for item spacing on the X-axis. This property allows to avoid drawing a label next to each tick, which is useful when the chart in question has a large data source attached to it. - charts : border line weight takes into account the line weight inferred from the chart style (48 chart styles) whenever there isn't a custom setting. - better preserve and render border styles in text boxes, vector shapes, pictures and chart elements. There was a discrepancy between chart border styles, MSO border styles and XLSX/XLSB border styles. | |
xlsgen 4.0.0.83 : Fixes for the calc engineBuild 4.0.0.83 of xlsgen includes two fixes for the built-in calculation engine. Namely, - HLOOKUP/VLOOKUP functions : correct handling of optional parameter when passed as an integer instead of a boolean. - INDIRECT function : correct handling of area reference case. | |
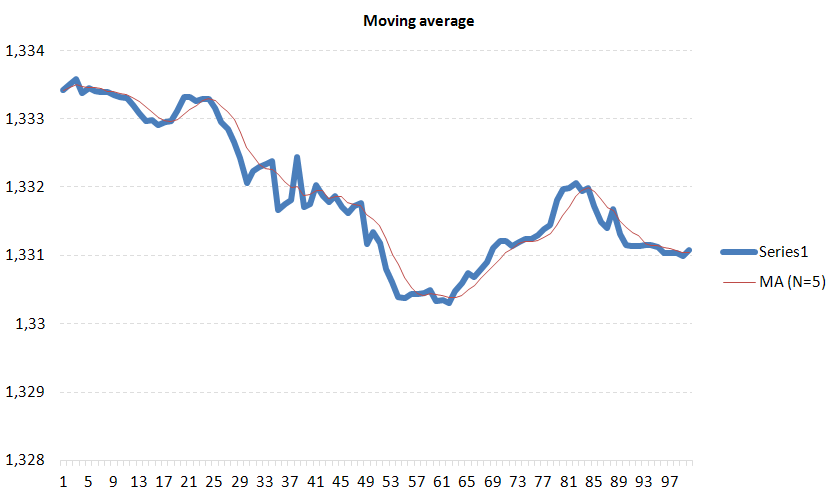
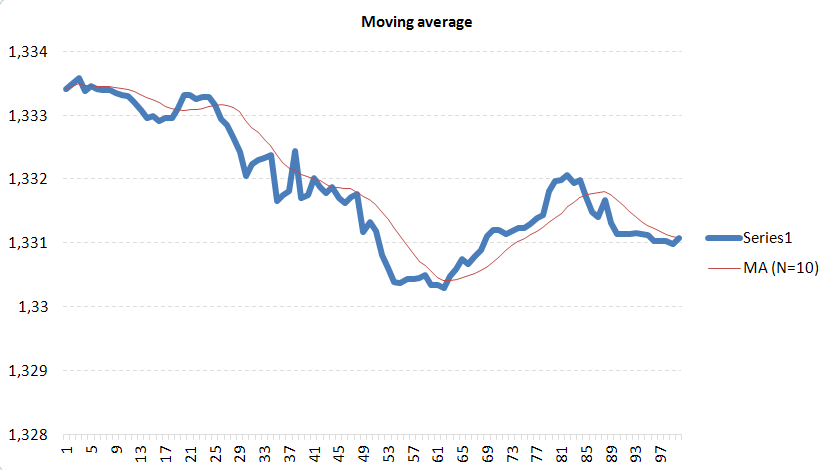
xlsgen 4.0.0.82 : New financial chart : moving averageBuild 4.0.0.82 of xlsgen adds support for moving average charts. Again those charts are not supported by Excel, so the goal of xlsgen is to provide chart for everyday needs.  Moving average (N=5) A moving average chart is a chart where a mathematical figure called average is calculated over time, resulting in a curve in and of itself. A moving average, by its nature, smooths out spikes, making it easier to see trends. This chart is often used in financial trading as a tool for analysis. The average calculation only takes a fraction, usually small, of past data, a parameter which is called N, which is why the chart is called moving average. By default, N=20, meaning that the point in that curve is defined by 20 older data points. The average, because it smoothens a signal, carries a late effect, which is obvious visually, which grows with the value of N. By opposite, the smaller N is, the tighter the average is to the data signal. Below are examples of the moving average with two other values of N, respectively 10 and 40.  Moving average (N=10)  Moving average (N=40)
The DataWindowSelection property is available in each series of data in order to customize the value of N. | |||
xlsgen 4.0.0.81 : New financial chart : Lorenz curveBuild 4.0.0.81 of xlsgen adds native support for Lorenz curves. Those charts are unknown to Excel so this is an original concept meant to match everyday needs.  Lorenz curve The Lorenz curve (named after Max Lorenz) represents the dispersion of inequalities, usually income, but not only. Wikipedia article. Points on the Lorenz curve represent statements like "the bottom 20% of all households have 10% of the total income.". A perfectly equal income distribution would be one in which every person has the same income (ideal curve displayed for comparison purposes). The Lorenz curve is always below the ideal curve. The data points on the horizontal axis shows the cumulated population and the data points on the vertical axis shows the cumulated income (or any other measure). The chart example above is made from the following data :
The Lorenz curve can be created from just raw Population and Income data, as is found in public files (government). xlsgen orders the data, computes cumuls and draws the line.
| ||||||||||||||||||||||||||||||||||||||
xlsgen 4.0.0.80 : Fixed memory leaksBuild 4.0.0.80 of xlsgen fixes 2 memory leaks that were harming the ability to use xlsgen in server scenarios, i.e. loaded with plenty of user requests, or working for hours or even days behind a web server. Memory leaks are the result of creating many internal data structures meant to compute so much stuff behind the scene and trying to optimize speed. Every now and then there must be a hold and check approach, as long as memory is not kept at regular levels, for making sure it is possible and even wise to keep adding more internal structures. After all, xlsgen is all the complexity of Excel, just without a user interface. | |
xlsgen 4.0.0.79 : Rendering sparklinesBuild 4.0.0.79 of xlsgen adds support for rendering sparklines in all rendering scenarios, i.e. print, print preview, PDF, XPS and HTML.  sparklines rendered in xlsgen For preview and XPS, the screen DPI is used for rendering. For print, the printer DPI is used (usually much higher than the screen DPI). For PDF, vectors are used (the output scales at will). For HTML, screen DPI is used and small images are created as html resources. | |
xlsgen 4.0.0.78 : Improved sparklinesBuild 4.0.0.78 of xlsgen improves the handling of Excel sparklines in a number of ways : - sparklines appear in the automatic source code generator, so you can manually create them in Excel and then obtain the corresponding source code in the programming language of your choice. No need to learn the xlsgen object model. Here is an example using VB of a group of 3 sparklines of type column : Dim sparklineGroup001s1 As IXlsSparkline Set sparklineGroup001s1 = wksht001.Sparklines.Add(enumSparklineType.sparklinetype_columns) sparklineGroup001s1.SparklineColor(enumSparklineElement.sparklineelement_values) = RGB(36,65,97) sparklineGroup001s1.SparklineColor(enumSparklineElement.sparklineelement_markers) = RGB(36,65,97) sparklineGroup001s1.SparklineColor(enumSparklineElement.sparklineelement_firstvalue) = RGB(149,180,214) sparklineGroup001s1.SparklineColor(enumSparklineElement.sparklineelement_lastvalue) = RGB(149,180,214) sparklineGroup001s1.ShowEmptyCellsAs = enumChartInterpolate.chartinterpolate_no Dim sparklineGroup001s1e0 As IXlsSparklineElement Set sparklineGroup001s1e0 = sparklineGroup001s1.Add sparklineGroup001s1e0.LocationRow = 3 sparklineGroup001s1e0.LocationColumn = 8 sparklineGroup001s1e0.DataAsFormula = "Sheet1!D3:G3" Dim sparklineGroup001s1e1 As IXlsSparklineElement Set sparklineGroup001s1e1 = sparklineGroup001s1.Add sparklineGroup001s1e1.LocationRow = 4 sparklineGroup001s1e1.LocationColumn = 8 sparklineGroup001s1e1.DataAsFormula = "Sheet1!D4:G4" Dim sparklineGroup001s1e2 As IXlsSparklineElement Set sparklineGroup001s1e2 = sparklineGroup001s1.Add sparklineGroup001s1e2.LocationRow = 5 sparklineGroup001s1e2.LocationColumn = 8 sparklineGroup001s1e2.DataAsFormula = "Sheet1!D5:G5" - sparklines are also duplicated in worksheet duplicate scenarios. - sparklines are also automatically updated when rows or columns are inserted or deleted, in order to reflect the changes. | |
xlsgen 4.0.0.77 : Table auto-filtersBuild 4.0.0.77 of xlsgen exposes table auto-filters in the object model. So beginning with this build, it's possible to either create or edit existing auto-filters in tables, and write them back in XLSX and XLSB files, thanks to the AutoFilter member exposed in the table results interface.So here is how it works : IXlsWorksheet worksheet = workbook.WorksheetByIndex[1]; // get the first table IXlsTable t = worksheet.Tables.Item[1]; // edit the filter in the second column of the table t.DataResults.AutoFilter.CustomFilter[2].CustomExpression = "> 2"; // remove the filter in the third column of the table t.DataResults.AutoFilter.CustomFilter[3].Delete(); | |
xlsgen 4.0.0.76 : Performance improvement for XLSX filesBuild 4.0.0.76 of xlsgen includes a performance improvement for processing XLSX files. The loading of drawings which was optimized for XLS files is now also optimized for XLSX files (and their variants). Namely, drawings that referred to many times are loaded only once. This improves memory depending on how large are the drawings, and also speed depending on how many factored drawings are to be loaded. | |
xlsgen 4.0.0.75 : Fix for CSV filesBuild 4.0.0.75 of xlsgen fixes a problem related to importing large CSV files, where large means wide columns. | |
xlsgen 4.0.0.74 : Improved XLSB compatibilityBuild 4.0.0.74 of xlsgen improves the compatibility with XLSB files when it comes to preserving the following objects : - slicers, table slicers, OLAP slicers - timelines, OLAP timelines - conditional formattings (O14 and O15) - range protection - sparklines - web extensions - data validations (O14) - pivot table references and decoupled - workbook properties (O14 and O15) - data model (power pivot) O14 = Excel 2010 O15 = Excel 2013 | |
xlsgen 4.0.0.73 : Windows 9X compatibilityBuild 4.0.0.73 of xlsgen adds the Windows 95/98-compatible version of xlsgen to our 32-bit Setup, zipped in the install folder. This Windows 95/98-compatible version proves useful for some of our customers and we recently broke the compatibility by having a DLL dependency unknown to Windows 95/98, and a number of Unicode-based WIN32 api calls that either do not work or are not available at all using Windows 95/98. In the 32-bit Setup, the main binary file (xlsgen.dll) isn't compatible with Windows 95/98 since it's built with a version of Visual Studio C++ that is unable to produce an image that is compatible with Windows 95/98 (courtesy of Microsoft). That's why the Windows 95/98-compatible version is a separate binary, built with a much older version of Visual Studio C++, with the same name (xlsgen.dll) and the same API, i.e. no need to recompile your client code. | |