| xlsgen > overview > Chart axis |

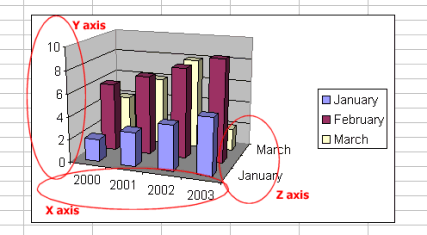
Each chart has a number of axis. 2D charts have X and Y axis. 3D charts have X, Y and Z axis.
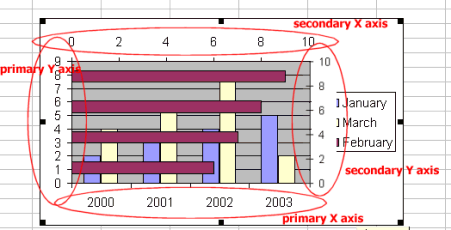
On a 2D chart, there are 4 axis in total. Two of these are known as primary axis, and are the X axis at the bottom, and the Y axis on the left hand-side. Secondary axis can be displayed and used (i.e. associated to a particular series of values), they are the secondary Y axis on the right-hand side, and the secondary X axis at the top.
Each axis can be accessed using the appropriate XAxis and YAxis properties from the chart object.
Each axis has a number of properties, including :
Each of these can be accessed from the IXlsChartAxis interface.
A plot area is the rectangular area where all series are drawn. It is displayed by default and has a grey background color as well as a black border line. When the chart type becomes a 3D chart, the plot area is replaced by walls and floor objects. Both of which are customizable with appropriate interfaces.

A 3D chart extends axis from a 2D chart by exposing a Z axis. Since there is no such "depth" axis duality, there is no such thing as a secondary or primary axis.
xlsgen documentation. © ARsT Design all rights reserved.