| xlsgen > overview > Normalize |


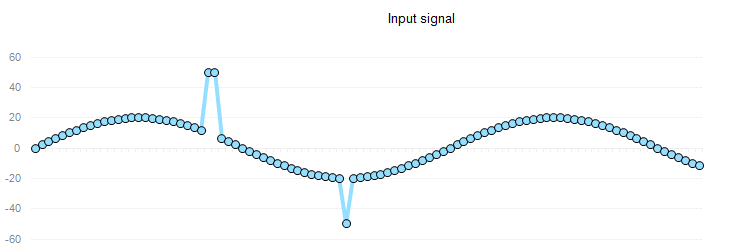
Chart normalize is a unique chart in xlsgen for removing extraneous data, data points that are obviously outside the normal scope, often resulting from measure errors and/or data quality loss.
In the example above, we have an input signal where a couple data points are extraneous. Calculating the normalized chart, the resulting signal is without the extraneous data. Note that there is no phase loss, i.e. removed data points are replaced with interpolated data points.
It is very simple to create such a chart :
| C++ code |
xlsgen::IXlsChartPtr chart = worksheet->NewChart(xlsgen::charttype_normalize, 4, 3, 18, 8); xlsgen::IXlsChartDynamicDataSourceSeriesPtr serie001 = chart->DynamicDataSource->AddSerie(); serie001->SeriesValuesFormula = L"Sheet1!$C$3:$C$99"; |
xlsgen documentation. © ARsT Design all rights reserved.