| xlsgen > overview > Relative strength index |

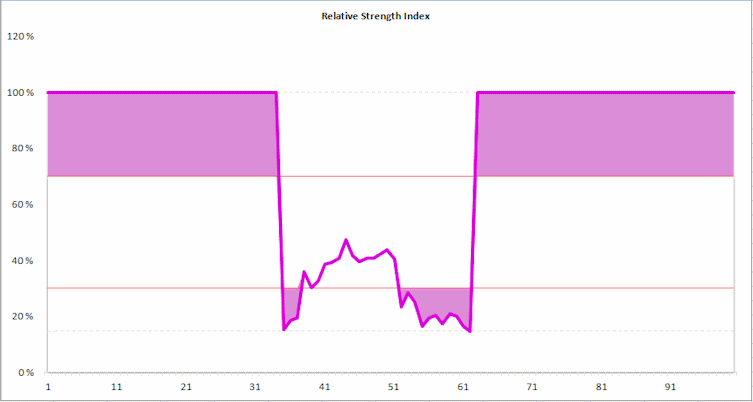
Chart Relative strength index is a unique chart in xlsgen for visualizing and predicting changes in data. It is a case of financial chart.
Relative strength index has meaning when it crosses a minimum value, 30%, and a maximum value, 70%. It is a buy/sell signal. It indicates the velocity of what is being measured. If what is being measured is a stock price, the relative strength index computes momentum as the ratio of higher closes to lower closes: stocks which have had more or stronger positive changes have a higher relative strength index than stocks which have had more or stronger negative changes.
Wilder, the inventor of the relative strength index, believed that tops and bottoms are indicated when relative strength index goes above 70 or drops below 30. Traditionally, relative strength index readings greater than the 70 level are considered to be in overbought territory, and relative strength index readings lower than the 30 level are considered to be in oversold territory. In between the 30 and 70 level is considered neutral, with the 50 level a sign of no trend.
| C++ code |
xlsgen::IXlsChartPtr chart = worksheet->NewChart(xlsgen::charttype_relativestrengthindex, 4, 3, 18, 8); xlsgen::IXlsChartDynamicDataSourceSeriesPtr serie001 = chart->DynamicDataSource->AddSerie(); serie001->SeriesValuesFormula = L"Sheet1!$C$3:$C$99"; |
xlsgen documentation. © ARsT Design all rights reserved.