| xlsgen > overview > Vector shapes |
Vector shapes can be added freely anywhere in a worksheet or associated to a chart (moves with the chart). Vector shapes are rendered by xlsgen during print/preview/PDF/...
Vector shapes are resizable graphics with border and area formatting properties. They can also be rotated or flipped around. Vector shapes are either stuck to the cells grid, or inside a chart (then moving when the chart moves).
xlsgen exposes around 200 basic shapes, such as rectangles, arrows, callouts, in order to make it easy to add vector shapes to a spreadsheet.
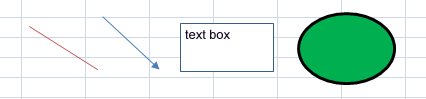
The location of a vector shape includes :
This is pictured like this :
For adding new vector shapes :
worksheet.NewVectorShape(vectorshapetype,
                                         row1,  // cell row
                                         col1,  // cell column
                                         row2,  // cell row
                                         col2,  // cell column
                                         topoffset, // number within the interval [0,256]
                                         leftoffset, // number within the interval [0,1024]
                                         bottomoffset, // number within the interval [0,256]
                                         rightoffset); // number within the interval [0,1024]
There is an alternate mechanism for locating anchors of vector shapes, which uses pixels. Pixels is a coordinate system whose origin is the top-left cell A1. It is exposed like this :
worksheet.NewVectorShapeInPixels(vectorshapetype,
                                         top,       // expressed in pixels
                                         left,       // expressed in pixels
                                         bottom,  // expressed in pixels
                                         right);  // expressed in pixels
In relation to working with pixels, it is always possible to query information about the Excel grid by using the Position property exposed in IXlsWorksheetColumns and IXlsWorksheetRows.
Vector shapes have a number of features exposed in the IXlsVectorShape interface :
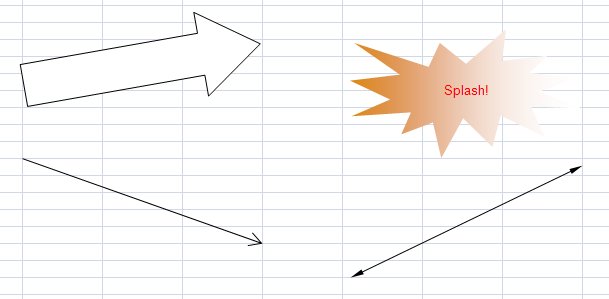
The following source code shows how to add the vector shapes picture above :
| Java code |
XlsWorksheet wksht = wbk.AddWorksheet( "Sheet1" );


XlsVectorShape sp = wksht.NewVectorShape(xlsgen.vectorshapetypeArrow,
                                            4, //row1
                                            2, //col1
                                            8, //row2
                                            4, //col2
                                            0, 0, 0, 0);
sp.putRotation(10);


XlsVectorShape sp2 = wksht.NewVectorShape(xlsgen.vectorshapetypeIrregularSeal1,
                                            4, //row1
                                            6, //col1
                                            11, //row2
                                            8, //col2
                                            100, 100, 0, 0);
sp2.putLabel("Splash!");

sp2.getPatterns().getArea().getGradient().getSingleColor().putGradientStyle(xlsgen.gradientstyle_verticall0);
sp2.getPatterns().getArea().getGradient().getSingleColor().putColor(0xDD8800);
sp2.getPatterns().getArea().getGradient().getSingleColor().putLightThreshold(100);
sp2.getPatterns().getBorders().putType(xlsgen.chartbordertype_none);

XlsStyle styleAlign = wksht.NewStyle();
styleAlign.getAlignment().putHorizontal(xlsgen.halign_center);
styleAlign.getFont().putColor(0xFF0000);
sp2.putStyle(styleAlign);


XlsVectorShape spArrow = wksht.NewVectorShape(xlsgen.vectorshapetypeLine,
                                            12, //row1
                                            2,  //col1
                                            16, //row2
                                            4,  //col2
                                            0, 0, 0, 0);
XlsVectorShapeArrow a = spArrow.getArrowStyleEndCap();
a.putStyle(xlsgen.vectorshapearrowstyle_open);
a.putWidth(xlsgen.vectorshapearrowwidth_wide);
a.putLength(xlsgen.vectorshapearrowlength_long);


XlsVectorShape spArrow2 = wksht.NewVectorShape(xlsgen.vectorshapetypeLine,
                                            12, //row1
                                            6, //col1
                                            18, //row2
                                            8, //col2
                                            100, 100, 0, 0);
XlsVectorShapeArrow b1 = spArrow2.getArrowStyleBeginCap();
b1.putStyle(xlsgen.vectorshapearrowstyle_triangle);
b1.putWidth(xlsgen.vectorshapearrowwidth_narrow);
b1.putLength(xlsgen.vectorshapearrowlength_long);
XlsVectorShapeArrow b2 = spArrow2.getArrowStyleEndCap();
b2.putStyle(xlsgen.vectorshapearrowstyle_triangle);
b2.putWidth(xlsgen.vectorshapearrowwidth_narrow);
b2.putLength(xlsgen.vectorshapearrowlength_long);
spArrow2.putFlipHorizontal(true);
|
| VB code |
Dim wksht As xlsgen.IXlsWorksheet
Set wksht = wbk.AddWorksheet("Sheet1")

Dim sp As xlsgen.IXlsVectorShape
Set sp = wksht.NewVectorShape(xlsgen.enumVectorShape.vectorshapetypeArrow, _
                                            4, _
                                            2, _
                                            8, _
                                            4, _
                                            0, 0, 0, 0)
sp.Rotation = 10


Dim sp2 As xlsgen.IXlsVectorShape
Set sp2 = wksht.NewVectorShape(xlsgen.enumVectorShape.vectorshapetypeIrregularSeal1, _
                                            4, _
                                            6, _
                                            11, _
                                            8, _
                                            100, 100, 0, 0)
sp2.Label = "Splash!"

sp2.Patterns.Area.Gradient.SingleColor.GradientStyle = xlsgen.enumChartGradientStyle.gradientstyle_verticall0
sp2.Patterns.Area.Gradient.SingleColor.Color = &HDD8800
sp2.Patterns.Area.Gradient.SingleColor.LightThreshold = 100
sp2.Patterns.Borders.Type = xlsgen.enumChartBorder.chartbordertype_none

Dim styleAlign As xlsgen.IXlsStyle
Set styleAlign = wksht.NewStyle
styleAlign.Alignment.Horizontal = xlsgen.enumHorizontalAlignment.halign_center
styleAlign.Font.Color = &HFF0000
sp2.Style = styleAlign


Dim spArrow As xlsgen.IXlsVectorShape
Set spArrow = wksht.NewVectorShape(xlsgen.enumVectorShape.vectorshapetypeLine, _
                                            12, _
                                            2, _
                                            16, _
                                            4, _
                                            0, 0, 0, 0)
Dim a As xlsgen.IXlsVectorShapeArrow
Set a = spArrow.ArrowStyleEndCap
a.Style = xlsgen.enumVectorShapeArrowStyle.vectorshapearrowstyle_open
a.Width = xlsgen.enumVectorShapeArrowWidth.vectorshapearrowwidth_wide
a.Length = xlsgen.enumVectorShapeArrowLength.vectorshapearrowlength_long


Dim spArrow2 As xlsgen.IXlsVectorShape
Set spArrow2 = wksht.NewVectorShape(xlsgen.enumVectorShape.vectorshapetypeLine, _
                                            12, _
                                            6, _
                                            18, _
                                            8, _
                                            100, 100, 0, 0)
Dim b1 As xlsgen.IXlsVectorShapeArrow
Set b1 = spArrow2.ArrowStyleBeginCap
b1.Style = xlsgen.enumVectorShapeArrowStyle.vectorshapearrowstyle_triangle
b1.Width = xlsgen.enumVectorShapeArrowWidth.vectorshapearrowwidth_narrow
b1.Length = xlsgen.enumVectorShapeArrowLength.vectorshapearrowlength_long
Dim b2 As xlsgen.IXlsVectorShapeArrow
Set b2 = spArrow2.ArrowStyleEndCap
b2.Style = xlsgen.enumVectorShapeArrowStyle.vectorshapearrowstyle_triangle
b2.Width = xlsgen.enumVectorShapeArrowWidth.vectorshapearrowwidth_narrow
b2.Length = xlsgen.enumVectorShapeArrowLength.vectorshapearrowlength_long
spArrow2.FlipHorizontal = True
|
| C# code |
IXlsWorksheet wksht = wbk.AddWorksheet( "Sheet1" );

IXlsVectorShape sp = wksht.NewVectorShape(enumVectorShape.vectorshapetypeArrow,
                                            4, //row1
                                            2, //col1
                                            8, //row2
                                            4, //col2
                                            0, 0, 0, 0);
sp.Rotation = 10;


IXlsVectorShape sp2 = wksht.NewVectorShape(enumVectorShape.vectorshapetypeIrregularSeal1,
                                            4, //row1
                                            6, //col1
                                            11, //row2
                                            8, //col2
                                            100, 100, 0, 0);
sp2.Label = "Splash!";

sp2.Patterns.Area.Gradient.SingleColor.GradientStyle = enumChartGradientStyle.gradientstyle_verticall0;
sp2.Patterns.Area.Gradient.SingleColor.Color = 0xDD8800;
sp2.Patterns.Area.Gradient.SingleColor.LightThreshold = 100;
sp2.Patterns.Borders.Type = enumChartBorder.chartbordertype_none;

IXlsStyle styleAlign = wksht.NewStyle();
styleAlign.Alignment.Horizontal = enumHorizontalAlignment.halign_center;
styleAlign.Font.Color = 0xFF0000;
sp2.Style = styleAlign;


IXlsVectorShape spArrow = wksht.NewVectorShape(enumVectorShape.vectorshapetypeLine,
                                            12, //row1
                                            2,  //col1
                                            16, //row2
                                            4,  //col2
                                            0, 0, 0, 0);
IXlsVectorShapeArrow a = spArrow.ArrowStyleEndCap;
a.Style = enumVectorShapeArrowStyle.vectorshapearrowstyle_open;
a.Width = enumVectorShapeArrowWidth.vectorshapearrowwidth_wide;
a.Length = enumVectorShapeArrowLength.vectorshapearrowlength_long;


IXlsVectorShape spArrow2 = wksht.NewVectorShape(enumVectorShape.vectorshapetypeLine,
                                            12, //row1
                                            6, //col1
                                            18, //row2
                                            8, //col2
                                            100, 100, 0, 0);
IXlsVectorShapeArrow b1 = spArrow2.ArrowStyleBeginCap;
b1.Style = enumVectorShapeArrowStyle.vectorshapearrowstyle_triangle;
b1.Width = enumVectorShapeArrowWidth.vectorshapearrowwidth_narrow;
b1.Length = enumVectorShapeArrowLength.vectorshapearrowlength_long;
IXlsVectorShapeArrow b2 = spArrow2.ArrowStyleEndCap;
b2.Style = enumVectorShapeArrowStyle.vectorshapearrowstyle_triangle;
b2.Width = enumVectorShapeArrowWidth.vectorshapearrowwidth_narrow;
b2.Length = enumVectorShapeArrowLength.vectorshapearrowlength_long;
spArrow2.FlipHorizontal = 1;
|
| C++ code |
xlsgen::IXlsWorksheetPtr wksht = wbk->AddWorksheet(L"Sheet1");


xlsgen::IXlsVectorShapePtr sp = wksht->NewVectorShape(xlsgen::vectorshapetypeArrow,
                                            4, //row1
                                            2, //col1
                                            8, //row2
                                            4, //col2
                                            0, 0, 0, 0);
sp->Rotation = 10;


xlsgen::IXlsVectorShapePtr sp2 = wksht->NewVectorShape(xlsgen::vectorshapetypeIrregularSeal1,
                                            4, //row1
                                            6, //col1
                                            11, //row2
                                            8, //col2
                                            100, 100, 0, 0);
sp2->Label = L"Splash!";

sp2->Patterns->Area->Gradient->SingleColor->GradientStyle = xlsgen::gradientstyle_verticall0;
sp2->Patterns->Area->Gradient->SingleColor->Color = 0xDD8800;
sp2->Patterns->Area->Gradient->SingleColor->LightThreshold = 100;
sp2->Patterns->Borders->Type = xlsgen::chartbordertype_none;

xlsgen::IXlsStylePtr styleAlign = wksht->NewStyle();
styleAlign->Alignment->Horizontal = xlsgen::halign_center;
styleAlign->Font->Color = 0xFF0000;
sp2->Style = styleAlign;


xlsgen::IXlsVectorShapePtr spArrow = wksht->NewVectorShape(xlsgen::vectorshapetypeLine,
                                            12, //row1
                                            2,  //col1
                                            16, //row2
                                            4,  //col2
                                            0, 0, 0, 0);
xlsgen::IXlsVectorShapeArrowPtr a = spArrow->ArrowStyleEndCap;
a->Style = xlsgen::vectorshapearrowstyle_open;
a->Width = xlsgen::vectorshapearrowwidth_wide;
a->Length = xlsgen::vectorshapearrowlength_long;


xlsgen::IXlsVectorShapePtr spArrow2 = wksht->NewVectorShape(xlsgen::vectorshapetypeLine,
                                            12, //row1
                                            6, //col1
                                            18, //row2
                                            8, //col2
                                            100, 100, 0, 0);
xlsgen::IXlsVectorShapeArrowPtr b1 = spArrow2->ArrowStyleBeginCap;
b1->Style = xlsgen::vectorshapearrowstyle_triangle;
b1->Width = xlsgen::vectorshapearrowwidth_narrow;
b1->Length = xlsgen::vectorshapearrowlength_long;
xlsgen::IXlsVectorShapeArrowPtr b2 = spArrow2->ArrowStyleEndCap;
b2->Style = xlsgen::vectorshapearrowstyle_triangle;
b2->Width = xlsgen::vectorshapearrowwidth_narrow;
b2->Length = xlsgen::vectorshapearrowlength_long;
spArrow2->FlipHorizontal = TRUE;
|
When a vector shape is added to a chart, the location setting differs in that the corners of the vector shape are not defined by cells, rather by a coordinate system within the chart, between 1 and 4000 on both directions. It works like this in practice :
| Java code |
XlsVectorShape spC = chart001s0.AddVectorShape(xlsgen.vectorshapetypeRightArrowCallout);
spC.putLabel("another label");
spC.putRotation(-20);
spC.getPatterns.getArea().putType(xlsgen.chartareatype_custom);
spC.getPatterns.getArea().getGradient().getDualColor().putGradientStyle(xlsgen.gradientstyle_horizontal0);
spC.getPatterns.getArea().getGradient().getDualColor().putFirstColor(0x00FF0000);
spC.getPatterns.getArea().getGradient().getDualColor().putSecondColor(0x000000FF);
spC.putLeftColumn(2000);  // 1-4000
spC.putRightColumn(3000); // 1-4000
spC.putTopCell(2500);     // 1-4000
spC.putBottomCell(3200);  // 1-4000
|
| VB code |
IXlsVectorShape spC = chart001s0.AddVectorShape(enumVectorShape.vectorshapetypeRightArrowCallout) spC.Label = "another label" spC.Rotation = -20 spC.Patterns.Area.Type = enumChartArea.chartareatype_custom spC.Patterns.Area.Gradient.DualColor.GradientStyle = enumChartGradientStyle.gradientstyle_horizontal0 spC.Patterns.Area.Gradient.DualColor.FirstColor = &H00FF0000 spC.Patterns.Area.Gradient.DualColor.SecondColor = &H000000FF spC.LeftColumn = 2000 ' 1-4000 spC.RightColumn = 3000 ' 1-4000 spC.TopCell = 2500 ' 1-4000 spC.BottomCell = 3200 ' 1-4000 |
| C# code |
IXlsVectorShape spC = chart001s0.AddVectorShape(enumVectorShape.vectorshapetypeRightArrowCallout); spC.Label = "another label"; spC.Rotation = -20; spC.Patterns.Area.Type = enumChartArea.chartareatype_custom; spC.Patterns.Area.Gradient.DualColor.GradientStyle = enumChartGradientStyle.gradientstyle_horizontal0; spC.Patterns.Area.Gradient.DualColor.FirstColor = 0x00FF0000; spC.Patterns.Area.Gradient.DualColor.SecondColor = 0x000000FF; spC.LeftColumn = 2000; // 1-4000 spC.RightColumn = 3000; // 1-4000 spC.TopCell = 2500; // 1-4000 spC.BottomCell = 3200; // 1-4000 |
| C++ code |
xlsgen::IXlsVectorShapePtr spC = chart001s0->AddVectorShape(xlsgen::vectorshapetypeRightArrowCallout); spC->Label = L"another label"; spC->Rotation = -20; spC->Patterns->Area->Type = xlsgen::chartareatype_custom; spC->Patterns->Area->Gradient->DualColor->GradientStyle = xlsgen::gradientstyle_horizontal0; spC->Patterns->Area->Gradient->DualColor->FirstColor = 0x00FF0000; spC->Patterns->Area->Gradient->DualColor->SecondColor = 0x000000FF; spC->LeftColumn = 2000; // 1-4000 spC->RightColumn = 3000; // 1-4000 spC->TopCell = 2500; // 1-4000 spC->BottomCell = 3200; // 1-4000 |
xlsgen renders (print/preview/PDF/...) the following basic shape types :
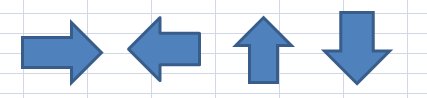

xlsgen renders both floating vector shapes and chart vector shapes.
xlsgen documentation. © ARsT Design all rights reserved.