| xlsgen > overview > Chart data source |
Attaching a data source to a chart is mandatory step to chart creation.
There are three data source types :
A picture speaks a thousand words. Let's take a look at the data source attached to this chart :
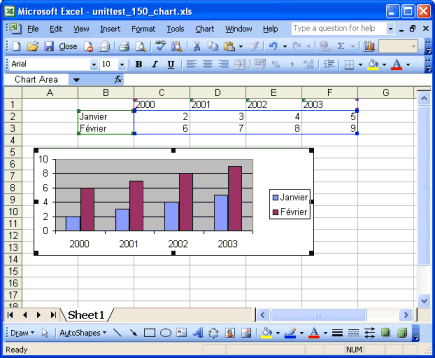
Range B1:F3 is the boundary of the data table we are interested in. This data source is called regular because by setting such explicit boundaries, no dynamic computation is going to alter the definition of the data source. Range B1:F3 is really the most obvious example of regular data source. You could make a union of such ranges, for instance B1:F3;B5:F7;B9:F11 and, assuming relevant data is stored in those cells, the chart will draw the corresponding values.
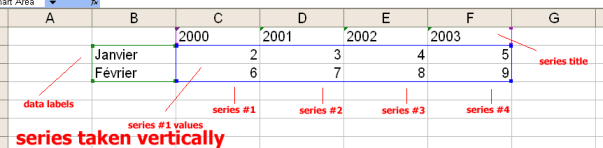
With that said, what is a data source? It's a collection of series. Each series has a number of values. Each series may or may not have a title, and this title can spread across several cells. For each series value, a title can be associated. This title is called a data label.
The boundaries define the extent of series, but don't define how series of values should be read, horizontally or vertically. In this example, if the series values are read horizontally, we have two series, each with 4 values. If series are read vertically, then we have 4 series, with 2 values in each. See the screen below :

By default, xlsgen reads series vertically. Anytime you need series to be taken care of horizontally, the following data source property must be used :
// series should be read horizontally
datasource.SeriesInRows = TRUE;
xlsgen automatically detects titles versus values based on cell types, whether cells contain strings or numerical values. That said, it is always possible to override xlsgen autodetection mechanism thanks to the following properties :
// how many titles per series (auto-detected)
datasource.SeriesTitleDepth = ___;
// how many data labels per value (auto-detected)
datasource.DataLabelDepth = ___;
// how many points per serie
datasource.PointsPerSeries = ___;
The properties should accomodate a lot of scenarios but not all. Here are two scenarios :
SeriesPerRangeArea and set it to 1.
A number of cases are summarized in a sample called charts_basic2.
A special attention must be paid for bubble charts as a series of values is made of two actual collections of values. The first collection of values serves the same purpose than for other chart types. The second collection of values is meant to govern bubble sizes. Make sure to take a look at bubble chart samples for more information.
A number of parameters are involved to make sure the visual representation of a chart is as good as possible, even in hard cases where for instance the data source is large so the plotting will look compressed at best, useless in most cases. xlsgen provides a mechanism known as data source sampling meant to make it possible to control the ratio of data to be used for rendering the chart.
If this ratio is set to 80% (0.8), 80% of the data is to be used and 20% of the data is ignored. The ignored data is spaced evenly across the entire data set. Conversedly, a ratio of 10% (0.10) ensures that just a tiny fraction of the data is used, and that most of the data (90%) is ignored. The larger the data set, the smaller the sampling ratio to use.
| Java code |
XlsChart chart = worksheet.NewChart(xlsgen.charttype_bar2D,
                                                              20, //row1
                                                              1,   //col1
                                                              31,  //row2
                                                              5    //col2
                                                             );

XlsChartDataSource datasource = chart.getDataSource();
datasource.putSeriesInRows(true);
datasource.putRange("R1C1:R3C240");
datasource.putPointsPerSeries(0.25); // 25% of the data used for rendering the chart
|
| VB code |
IXlsChart chart = worksheet.NewChart(enumChartType.charttype_bar2D, _
                                                              20, _
                                                              1,  _
                                                              31, _
                                                              5)

IXlsChartDataSource datasource = chart.DataSource
datasource.SeriesInRows = True
datasource.Range = "R1C1:R3C240"
datasource.PointsPerSeries = 0.25 ' 25% of the data used for rendering the chart
|
| C# code |
IXlsChart chart = worksheet.NewChart(enumChartType.charttype_bar2D,
                                                              20, //row1
                                                              1,   //col1
                                                              31,  //row2
                                                              5    //col2
                                                             );

IXlsChartDataSource datasource = chart.DataSource;
datasource.SeriesInRows = true;
datasource.Range = "R1C1:R3C240";
datasource.PointsPerSeries = 0.25; // 25% of the data used for rendering the chart
|
| C/C++ code |
xlsgen::IXlsChartPtr chart = worksheet->NewChart(xlsgen::charttype_bar2D,
                                                              20, //row1
                                                              1,   //col1
                                                              31,  //row2
                                                              5    //col2
                                                             );

xlsgen::IXlsChartDataSourcePtr datasource = chart->DataSource;
datasource->SeriesInRows = TRUE;
datasource->Range = L"R1C1:R3C240";
datasource->PointsPerSeries = 0.25; // 25% of the data used for rendering the chart
|
While regular data sources should provide support for most needs, there sometimes is a need to change the boundaries of series, titles and values dynamically over time. Dynamic data sources are aimed to do just that, allow to define formulas which govern series, titles and values in such a way that the underlying data will be automatically taken into account without having to edit chart properties.
A code sample called charts_dynamic_datasource provides an example of this.
| C/C++ code |
xlsgen::IXlsChartPtr chart1 = worksheet->NewChart(xlsgen::charttype_bar2D,
                                                     15, //row1
                                                     1, //col1
                                                     25, //row2
                                                     5 //col2
                                                    );

xlsgen::IXlsChartDynamicDataSourcePtr datasource1 = chart1->DynamicDataSource;

xlsgen::IXlsChartDynamicDataSourceSeriesPtr serie1 = datasource1->AddSerie();
serie1->DataLabelsFormula = L"=$C$1:$H$1";
serie1->SeriesTitlesFormula = L"=$B$2:$B$2";
serie1->SeriesValuesFormula = L"=$C$2:$H$2";

xlsgen::IXlsChartDynamicDataSourceSeriesPtr serie2 = datasource1->AddSerie();
serie2->DataLabelsFormula = L"=$C$1:$H$1";
serie2->SeriesTitlesFormula = L"=$B$3:$B$3";
serie2->SeriesValuesFormula = L"=$C$3:$H$3";
|
In any case, if you are interested by accessing the actual values and labels of the data source, you can always browse the collection of series by index or by name, then query the ActualValues and ActualLabels properties respectively.
On-the-fly charts is a mechanism for using charts whose data source is an array of constant values as opposed to cell references. Here is an example of on-the-fly chart :
| Java code |
XlsWorkbook wbk = engine.New( "on_the_fly_chart_rendering.xlsx" );

XlsWorksheet wksht = wbk.AddWorksheet( "Sheet1" );

XlsChart chart = wksht.NewChart(xlsgen.charttype_line2D, 3, 3, 10, 8);

// Our on-the-fly data (notice the lack of cell reference)
XlsChartDynamicDataSourceSeries serie1 = chart.getDynamicDataSource().AddSerie();
serie1.putSeriesTitlesFormula( "=\"Serie title\"" );
serie1.putDataLabelsFormula( "={\"jan\";\"feb\";\"mar\";\"apr\";\"may\";\"jun\";\"jul\";\"aug\";\"sep\";\"oct\";\"nov\";\"dec\"}" );
serie1.putSeriesValuesFormula( "={10;9.5;8;6;8;7;11;12;13.5;12.5;11.4;9}" );

// Some minor formatting...
chart.getXAxis(xlsgen.chartaxis_primary).putShow(false);
chart.getLegend().putShow(xlsgen.chartlegend_hidden);
chart.getMainTitle.putLabel("");

wksht.getExport().ExportAsPDF("on_the_fly_chart_rendering.pdf");

wbk.Close();
|
| VB code |
Dim wbk As IXlsWorkbook
Set wbk = engine.New( "on_the_fly_chart_rendering.xlsx" )

Dim wksht As IXlsWorksheet
Set wksht = wbk.AddWorksheet( "Sheet1" )

Dim chart As IXlsChart
Set chart = wksht.NewChart(enumChartType.charttype_line2D, 3, 3, 10, 8)

' Our on-the-fly data (notice the lack of cell reference)
Dim serie1 As IXlsChartDynamicDataSourceSeries
Set serie1 = chart.DynamicDataSource.AddSerie
serie1.SeriesTitlesFormula = "=\"Serie title\""
serie1.DataLabelsFormula = "={\"jan\";\"feb\";\"mar\";\"apr\";\"may\";\"jun\";\"jul\";\"aug\";\"sep\";\"oct\";\"nov\";\"dec\"}"
serie1.SeriesValuesFormula = "={10;9.5;8;6;8;7;11;12;13.5;12.5;11.4;9}"

' Some minor formatting...
chart.XAxis(enumChartAxisType.chartaxis_primary).Show = False
chart.Legend.Show = enumChartLegend.chartlegend_hidden
chart.MainTitle.Label = ""

wksht.Export.ExportAsPDF("on_the_fly_chart_rendering.pdf")

wbk.Close
|
| C# code |
IXlsWorkbook wbk = engine.New( "on_the_fly_chart_rendering.xlsx" );

IXlsWorksheet wksht = wbk.AddWorksheet( "Sheet1" );

IXlsChart chart = wksht.NewChart(enumChartType.charttype_line2D, 3, 3, 10, 8);

// Our on-the-fly data (notice the lack of cell reference)
IXlsChartDynamicDataSourceSeries serie1 = chart.DynamicDataSource.AddSerie();
serie1.SeriesTitlesFormula = "=\"Serie title\"";
serie1.DataLabelsFormula = "={\"jan\";\"feb\";\"mar\";\"apr\";\"may\";\"jun\";\"jul\";\"aug\";\"sep\";\"oct\";\"nov\";\"dec\"}";
serie1.SeriesValuesFormula = "={10;9.5;8;6;8;7;11;12;13.5;12.5;11.4;9}";

// Some minor formatting...
chart.get_XAxis(enumChartAxisType.chartaxis_primary).Show = false;
chart.Legend.Show = enumChartLegend.chartlegend_hidden;
chart.MainTitle.Label = "";

wksht.Export.ExportAsPDF("on_the_fly_chart_rendering.pdf");

wbk.Close();
|
| C/C++ code |
xlsgen::IXlsWorkbookPtr wbk = engine->New( L"on_the_fly_chart_rendering.xlsx" );

xlsgen::IXlsWorksheetPtr wksht = wbk->AddWorksheet( L"Sheet1" );

xlsgen::IXlsChartPtr chart = wksht->NewChart(xlsgen::charttype_line2D, 3, 3, 10, 8);

// Our on-the-fly data (notice the lack of cell reference)
xlsgen::IXlsChartDynamicDataSourceSeriesPtr serie1 = chart->DynamicDataSource->AddSerie();
serie1->SeriesTitlesFormula = L"=\"Serie title\"";
serie1->DataLabelsFormula = L"={\"jan\";\"feb\";\"mar\";\"apr\";\"may\";\"jun\";\"jul\";\"aug\";\"sep\";\"oct\";\"nov\";\"dec\"}";
serie1->SeriesValuesFormula = L"={10;9.5;8;6;8;7;11;12;13.5;12.5;11.4;9}";

// Some minor formatting...
chart->XAxis[xlsgen::chartaxis_primary]->Show = FALSE;
chart->Legend->Show = xlsgen::chartlegend_hidden;
chart->MainTitle->Label = L"";

wksht->Export->ExportAsPDF(L"on_the_fly_chart_rendering.pdf");

wbk->Close();
|
And the result is :
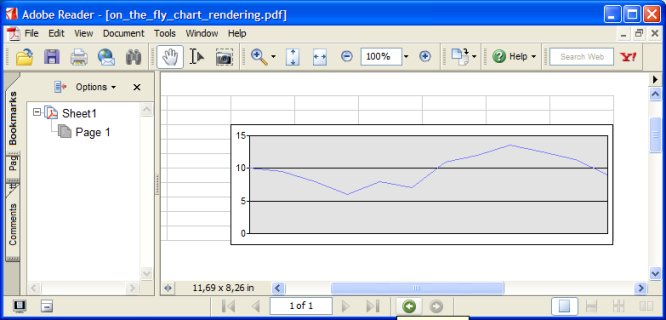
An example of on-the-fly chart
Pivot charts simply associate an arbitrary chart to an existing pivot table so that the rows and columns that make the pivot table are used as data source for the chart. All the common chart formatting remains available.
A PivotTableDataSource property is available in the chart object interface in order to make the association to an existing pivot table.
| C/C++ code |
// create a pivot table xlsgen::IXlsWorksheetPtr wkshtNew = workbook->AddWorksheet( L"SheetNew" ); xlsgen::IXlsPivotTablePtr pt = wkshtNew->NewPivotTable(); pt->DataSource->Range = L"Data!A1:E6"; xlsgen::IXlsPivotTableFieldPtr pf_v0 = pt->Data->AddByName(L"Group Name"); xlsgen::IXlsPivotTableFieldPtr pf_v1 = pt->Data->AddByName(L"Value1"); xlsgen::IXlsPivotTableFieldPtr pf_v2 = pt->Data->AddByName(L"Value2"); xlsgen::IXlsPivotTableFieldPtr pf_v3 = pt->Data->AddByName(L"Value3"); xlsgen::IXlsPivotTableFieldPtr pf_d1 = pt->Rows->AddDataFields(); // in rows pt->InsertAt(5,2); // create a chart xlsgen::IXlsWorksheetPtr wkshtChart = workbook->AddWorksheet( L"Chart" ); xlsgen::IXlsChartPtr chart = wkshtChart->NewChart(xlsgen::charttype_bar2D, 2, //row1 2, //col1 17, //row2 9 //col2 ); // attach the chart to the pivot table chart->PivotTableDataSource = pt; |
In Excel, pivot charts can be tweaked by slicing and dicing rows and columns, as they reflect the pivot table slicing and dicing. Of course, the same can be done programmatically with xlsgen when the pivot table is being created.
xlsgen documentation. © ARsT Design all rights reserved.