| xlsgen > overview > Pivot tables |

In xlsgen, pivot tables are very easy to create. Basically there are three steps :
Pivot table creation is supported both in XLS files (and their variants), XLSX files (and their variants), XLSB files and Open Office (LibreOffice) ODS files.
If you don't know where to start, create a pivot table manually in Excel, and use the automatic source code generation tool in order to obtain the corresponding source code :

And the corresponding source code (C++) :
| C++ code |
xlsgen::IXlsPivotTablePtr pivotTable002s0 = wksht002->NewPivotTable(); pivotTable002s0->DataSource->Range = L"Sheet2!B2:F7"; pivotTable002s0->Options->Layout = xlsgen::pivottablelayout_tabular; pivotTable002s0->Options->BuiltInPivotTableStyle = xlsgen::pivottablestyle_light16; pivotTable002s0->Options->ShowRowHeaders = TRUE; pivotTable002s0->Options->ShowColumnHeaders = TRUE; pivotTable002s0->Options->ShowRowStripes = FALSE; pivotTable002s0->Options->ShowColumnStripes = FALSE; pivotTable002s0->Options->ShowGrandTotalsForRows = TRUE; pivotTable002s0->Options->ShowGrandTotalsForColumns = TRUE; xlsgen::IXlsPivotTableFieldPtr pf002s0r1 = pivotTable002s0->Rows->AddByName(L"s0"); pf002s0r1->AggregateFunction = xlsgen::aggrpivotfunction_none; pf002s0r1->UnselectItemByName(L"ať"); xlsgen::IXlsPivotTableFieldPtr pf002s0r2 = pivotTable002s0->Rows->AddByName(L"s1"); xlsgen::IXlsPivotTableFieldPtr pf002s0d1 = pivotTable002s0->Data->AddByName(L"s2"); pivotTable002s0->InsertAt(13, 4); |
The IXlsPivotTable interface is self-describing.
Using source code it would look like the following :
| Java code |
XlsPivotTable pt = wkshtNew.NewPivotTable();
pt.getDataSource().putRange("Sheet1!D5:H20");

pt.getRows().AddByName("Product");
pt.getRows().AddByName("Date");
pt.getData().AddByName("Price");

pt.InsertAt(1,1);
|
| VB code |
Dim pt As IXlsPivotTable
Set pt = wkshtNew.NewPivotTable
pt.DataSource.Range = "Sheet1!D5:H20"

pt.Rows.AddByName("Product")
pt.Rows.AddByName("Date")
pt.Data.AddByName("Price")

pt.InsertAt(1,1)
|
| C# code |
IXlsPivotTable pt = wkshtNew.NewPivotTable();
pt.DataSource.Range = "Sheet1!D5:H20";

pt.Rows.AddByName("Product");
pt.Rows.AddByName("Date");
pt.Data.AddByName("Price");

pt.InsertAt(1,1);
|
| C++ code |
xlsgen::IXlsPivotTablePtr pt = wkshtNew->NewPivotTable(); pt->DataSource->Range = L"Sheet1!D5:H20"; pt->Rows->AddByName(L"Product"); pt->Rows->AddByName(L"Date"); pt->Data->AddByName(L"Price"); pt->InsertAt(1,1); |
A data source is basically a rectangular area of data. The first row is expected to have headers which in turn are used internally to give names to pivot table fields that can be sliced and diced later on. The data source definition is either an explicit cell area, a defined name or a table name.
A data source is either from a worksheet of the current workbook or from a worksheet of another workbook. So pivot tables can be created and refreshed from external data.
By combining SQL queries and pivot tables in that order it is possible to populate a worksheet from an arbitrary SQL database and then create a pivot table from it.
By default in xlsgen, data sources are marked as refreshed on load, that is anytime the Excel file is opened by the user. Using the appropriate code, this behavior can be changed and by doing so the user can manually refresh the data source by clicking on the Refresh button in Excel.
Each column in the datasource is a pivot table field, whose default name is from the first row of the datasource. Pivot table fields can then be sliced and diced in any of the four field areas, which are :
Each pivot table field set in one of the four areas is then projected according to a layout algorithm which reflects the intention of the application.
The data area plays a special role. Pivot table fields set in the data area are calculated by aggregating their values. The default aggregate function for numeric pivot table fields is the Sum() function. The default aggregate function for non-numeric pivot table fields is the Count() function. Of course, the aggregate function can be changed.
Each pivot table field can be sorted and filtered. Multiple settings are available.
Auto-filters provide users an interactive way to put constraints on how data is displayed.
Once the pivot table fields are laid out in the four areas, the pivot table can be added to the worksheet trivially by just using the InsertAt() method.
Here is the exact source code which produces the pivot table pictured above :
| Java code |
XlsWorksheet wkshtNew = workbook.AddWorksheet( "SheetNew" );

XlsPivotTable pt = wkshtNew.NewPivotTable();
pt.getDataSource().putRange("JUNCT!A1:E380");

XlsPivotTableField pf_year = pt.getRows().AddByName("YR_INST");
pf_year.putSortAscending(true);
pf_year.UnselectItemByName("2000");
pf_year.UnselectItemByName("2001");
pf_year.UnselectItemByName("2002");
pf_year.UnselectItemByName("2005");
pf_year.UnselectItemByName("2006");
pt.getRows().AddByName("DESCRIPT");
pt.getData().AddByName("ID");

pt.InsertAt(2,2);
|
| VB code |
Dim wkshtNew As IXlsWorksheet
Set wkshtNew = workbook.AddWorksheet( "SheetNew" )

Dim pt As IXlsPivotTable
Set pt = wkshtNew.NewPivotTable
pt.DataSource.Range = "JUNCT!A1:E380"

Dim pf_year As IXlsPivotTableField
Set pf_year = pt.Rows.AddByName("YR_INST")
pf_year.SortAscending = True
pf_year.UnselectItemByName("2000")
pf_year.UnselectItemByName("2001")
pf_year.UnselectItemByName("2002")
pf_year.UnselectItemByName("2005")
pf_year.UnselectItemByName("2006")
pt.Rows.AddByName("DESCRIPT")
pt.Data.AddByName("ID")

pt.InsertAt(2,2)
|
| C# code |
IXlsWorksheet wkshtNew = workbook.AddWorksheet( "SheetNew" );

IXlsPivotTable pt = wkshtNew.NewPivotTable();
pt.DataSource.Range = "JUNCT!A1:E380";

IXlsPivotTableField pf_year = pt.Rows.AddByName("YR_INST");
pf_year.SortAscending = true;
pf_year.UnselectItemByName("2000");
pf_year.UnselectItemByName("2001");
pf_year.UnselectItemByName("2002");
pf_year.UnselectItemByName("2005");
pf_year.UnselectItemByName("2006");
pt.Rows.AddByName("DESCRIPT");
pt.Data.AddByName("ID");

pt.InsertAt(2,2);
|
| C++ code |
xlsgen::IXlsWorksheetPtr wkshtNew = workbook->AddWorksheet( L"SheetNew" ); xlsgen::IXlsPivotTablePtr pt = wkshtNew->NewPivotTable(); pt->DataSource->Range = L"JUNCT!A1:E380"; xlsgen::IXlsPivotTableFieldPtr pf_year = pt->Rows->AddByName(L"YR_INST"); pf_year->SortAscending = TRUE; pf_year->UnselectItemByName(L"2000"); pf_year->UnselectItemByName(L"2001"); pf_year->UnselectItemByName(L"2002"); pf_year->UnselectItemByName(L"2005"); pf_year->UnselectItemByName(L"2006"); pt->Rows->AddByName(L"DESCRIPT"); pt->Data->AddByName(L"ID"); pt->InsertAt(2,2); |
The following custom options are available :
RefreshOnLoad property of the IXlsPivotTableDatasource interface lets you set whether the user will refresh the data source him/herself using Excel's UI, or if the data source is automatically refreshed next time Excel opens the file.
AggregateFunction in the IXlsPivotTableField interface. The Nums variation is for choosing how to handle blank cells.
BuiltInPivotTableStyle property (or CustomPivotTableStyle) of the IXlsPivotTableOptions interface.
xlsgen renders pivot tables whenever applicable (PDF, HTML, ...). The rendering engine acts upon the pivot table field specifications and properties in order to compute the corresponding rows and columns.
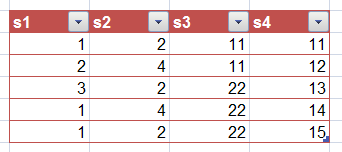
Let's take an example, assuming you have the following data :

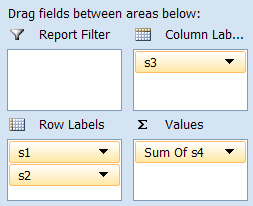
And let's assume you would like pivot table fields arranged this way :

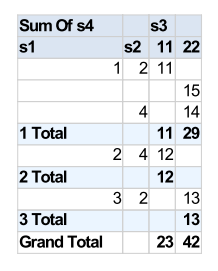
Here is the output, as calculated and rendered by xlsgen :

Pivot table rendering can be disabled/enabled with the corresponding source code :
| Java code |
pivotTable.getOptions().putAutoRendering(false); disable the rendering |
| VB code |
pivotTable.Options.AutoRendering = False disable the rendering |
| C# code |
pivotTable.Options().AutoRendering = false; disable the rendering |
| C++ code |
pivotTable->Options->AutoRendering = FALSE; disable the rendering |
xlsgen documentation. © ARsT Design all rights reserved.