| xlsgen > overview > Financial charts |
xlsgen supports a number of financial charts. There are built-in financial charts, such as stock charts, built in Excel for many years, and there are charts created by xlsgen that Excel cannot build for you.
high low close charts are made of 3 series in the following order :
This chart type is used by some technical analysts, on which, as illustrated below, the top of the vertical line indicates the highest price a security traded at during the day, and the bottom represents the lowest price. The closing price is displayed on the right side of the bar.
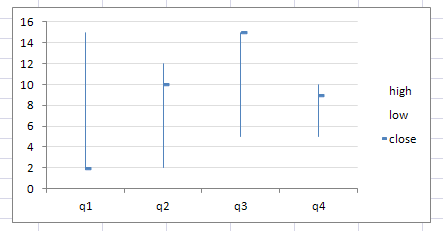
Here is how to create such a chart using xlsgen :
| Java code |
XlsChart chart001s0 = worksheet.NewChart(xlsgen.charttype_stockHighLowClose, row1, col1, row2, col2);
XlsChartDynamicDataSource datasource001s0 = chart001s0.getDynamicDataSource();
XlsChartDynamicDataSourceSeries serie001s0ss0 = datasource001s0.AddSerie();
serie001s0ss0.putSeriesTitlesFormula("=\"high\"");
serie001s0ss0.putDataLabelsFormula("={\"q1\";\"q2\";\"q3\";\"q4\"}");
serie001s0ss0.putSeriesValuesFormula("={15;12;15;10}");
XlsChartDynamicDataSourceSeries serie001s0ss1 = datasource001s0.AddSerie();
serie001s0ss1.putSeriesTitlesFormula("\"low\"");
serie001s0ss1.putDataLabelsFormula("={\"q1\";\"q2\";\"q3\";\"q4\"}");
serie001s0ss1.putSeriesValuesFormula("={2;2;5;5}");
XlsChartDynamicDataSourceSeries serie001s0ss2 = datasource001s0.AddSerie();
serie001s0ss2.putSeriesTitlesFormula("\"close\"");
serie001s0ss2.putDataLabelsFormula("={\"q1\";\"q2\";\"q3\";\"q4\"}");
serie001s0ss2.putSeriesValuesFormula("={2;10;15;9}");
|
| VB code |
Dim chart001s0 As IXlsChart
Set chart001s0 = worksheet.NewChart(enumChartType.charttype_stockHighLowClose, row1, col1, row2, col2)
Dim datasource001s0 As IXlsChartDynamicDataSource
Set datasource001s0 = chart001s0.DynamicDataSource
Dim serie001s0ss0 As IXlsChartDynamicDataSourceSeries
Set serie001s0ss0 = datasource001s0.AddSerie
serie001s0ss0.SeriesTitlesFormula = "=\"high\""
serie001s0ss0.DataLabelsFormula = "={\"q1\";\"q2\";\"q3\";\"q4\"}"
serie001s0ss0.SeriesValuesFormula = "={15;12;15;10}"
Dim serie001s0ss1 As IXlsChartDynamicDataSourceSeries
Set serie001s0ss1 = datasource001s0.AddSerie
serie001s0ss1.SeriesTitlesFormula = "\"low\""
serie001s0ss1.DataLabelsFormula = "={\"q1\";\"q2\";\"q3\";\"q4\"}"
serie001s0ss1.SeriesValuesFormula = "={2;2;5;5}"
Dim serie001s0ss2 As IXlsChartDynamicDataSourceSeries
Set serie001s0ss2 = datasource001s0.AddSerie
serie001s0ss2.SeriesTitlesFormula = "\"close\""
serie001s0ss2.DataLabelsFormula = "={\"q1\";\"q2\";\"q3\";\"q4\"}"
serie001s0ss2.SeriesValuesFormula = "={2;10;15;9}"
|
| C# code |
IXlsChart chart001s0 = worksheet.NewChart(enumChartType.charttype_stockHighLowClose, row1, col1, row2, col2);
IXlsChartDynamicDataSource datasource001s0 = chart001s0.DynamicDataSource;
IXlsChartDynamicDataSourceSeries serie001s0ss0 = datasource001s0.AddSerie();
serie001s0ss0.SeriesTitlesFormula = "=\"high\"";
serie001s0ss0.DataLabelsFormula = "={\"q1\";\"q2\";\"q3\";\"q4\"}";
serie001s0ss0.SeriesValuesFormula = "={15;12;15;10}";
IXlsChartDynamicDataSourceSeries serie001s0ss1 = datasource001s0.AddSerie();
serie001s0ss1.SeriesTitlesFormula = "\"low\"";
serie001s0ss1.DataLabelsFormula = "={\"q1\";\"q2\";\"q3\";\"q4\"}";
serie001s0ss1.SeriesValuesFormula = "={2;2;5;5}";
IXlsChartDynamicDataSourceSeries serie001s0ss2 = datasource001s0.AddSerie();
serie001s0ss2.SeriesTitlesFormula = "\"close\"";
serie001s0ss2.DataLabelsFormula = "={\"q1\";\"q2\";\"q3\";\"q4\"}";
serie001s0ss2.SeriesValuesFormula = "={2;10;15;9}";
|
| C/C++ code |
xlsgen::IXlsChartPtr chart001s0 = worksheet->NewChart(xlsgen::charttype_stockHighLowClose, row1, col1, row2, col2);
xlsgen::IXlsChartDynamicDataSourcePtr datasource001s0 = chart001s0->DynamicDataSource;
xlsgen::IXlsChartDynamicDataSourceSeriesPtr serie001s0ss0 = datasource001s0->AddSerie();
serie001s0ss0->SeriesTitlesFormula = L"=\"high\"";
serie001s0ss0->DataLabelsFormula = L"={\"q1\";\"q2\";\"q3\";\"q4\"}";
serie001s0ss0->SeriesValuesFormula = L"={15;12;15;10}";
xlsgen::IXlsChartDynamicDataSourceSeriesPtr serie001s0ss1 = datasource001s0->AddSerie();
serie001s0ss1->SeriesTitlesFormula = L"\"low\"";
serie001s0ss1->DataLabelsFormula = L"={\"q1\";\"q2\";\"q3\";\"q4\"}";
serie001s0ss1->SeriesValuesFormula = L"={2;2;5;5}";
xlsgen::IXlsChartDynamicDataSourceSeriesPtr serie001s0ss2 = datasource001s0->AddSerie();
serie001s0ss2->SeriesTitlesFormula = L"\"close\"";
serie001s0ss2->DataLabelsFormula = L"={\"q1\";\"q2\";\"q3\";\"q4\"}";
serie001s0ss2->SeriesValuesFormula = L"={2;10;15;9}";
|
open high low close charts are made of 4 series in the following order :
In Excel, open high low close charts are represented using candle sticks which are a combination of lines and bars. The candle stick has a thin vertical line showing the period's trading range. And a wide bar on the vertical line for low and high values. When the price of the stock is up and closes above the opening trade, the candle stick will usually be white. If the stock has traded down for the period, then the candle stick will usually be black.
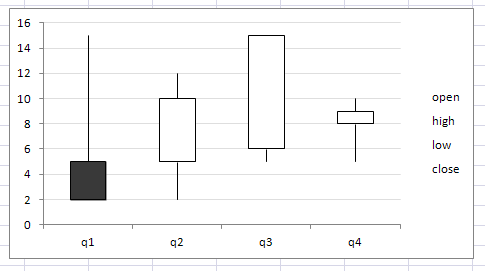
Here is how to create such a chart using xlsgen :
| Java code |
XlsChart chart001s0 = worksheet.NewChart(xlsgen.charttype_stockOpenHighLowClose, row1, col1, row2, col2);
XlsChartDynamicDataSource datasource001s0 = chart001s0.getDynamicDataSource();
XlsChartDynamicDataSourceSeries serie001s0ss0 = datasource001s0.AddSerie();
serie001s0ss0.putSeriesTitlesFormula("=\"open"");
serie001s0ss0.putDataLabelsFormula("={\"q1\";\"q2\";\"q3\";\"q4\"}");
serie001s0ss0.putSeriesValuesFormula("={5;5;6;8}");
XlsChartDynamicDataSourceSeries serie001s0ss1 = datasource001s0.AddSerie();
serie001s0ss1.putSeriesTitlesFormula("=\"high\"");
serie001s0ss1.putDataLabelsFormula("={\"q1\";\"q2\";\"q3\";\"q4\"}");
serie001s0ss1.putSeriesValuesFormula("={15;12;15;10}");
XlsChartDynamicDataSourceSeries serie001s0ss2 = datasource001s0.AddSerie();
serie001s0ss2.putSeriesTitlesFormula("\"low\"");
serie001s0ss2.putDataLabelsFormula("={\"q1\";\"q2\";\"q3\";\"q4\"}");
serie001s0ss2.putSeriesValuesFormula("={2;2;5;5}");
XlsChartDynamicDataSourceSeries serie001s0ss3 = datasource001s0.AddSerie();
serie001s0ss3.putSeriesTitlesFormula("\"close\"");
serie001s0ss3.putDataLabelsFormula("={\"q1\";\"q2\";\"q3\";\"q4\"}");
serie001s0ss3.putSeriesValuesFormula("={2;10;15;9}");
|
| VB code |
Dim chart001s0 As IXlsChart
Set chart001s0 = worksheet.NewChart(enumChartType.charttype_stockOpenHighLowClose, row1, col1, row2, col2)
Dim datasource001s0 As IXlsChartDynamicDataSource
Set datasource001s0 = chart001s0.DynamicDataSource
Dim serie001s0ss0 As IXlsChartDynamicDataSourceSeries
Set serie001s0ss0 = datasource001s0.AddSerie
serie001s0ss0.SeriesTitlesFormula = "=\"open""
serie001s0ss0.DataLabelsFormula = "={\"q1\";\"q2\";\"q3\";\"q4\"}"
serie001s0ss0.SeriesValuesFormula = "={5;5;6;8}"
Dim serie001s0ss1 As IXlsChartDynamicDataSourceSeries
Set serie001s0ss1 = datasource001s0.AddSerie
serie001s0ss1.SeriesTitlesFormula = "=\"high\""
serie001s0ss1.DataLabelsFormula = "={\"q1\";\"q2\";\"q3\";\"q4\"}"
serie001s0ss1.SeriesValuesFormula = "={15;12;15;10}"
Dim serie001s0ss2 As IXlsChartDynamicDataSourceSeries
Set serie001s0ss2 = datasource001s0.AddSerie
serie001s0ss2.SeriesTitlesFormula = "\"low\""
serie001s0ss2.DataLabelsFormula = "={\"q1\";\"q2\";\"q3\";\"q4\"}"
serie001s0ss2.SeriesValuesFormula = "={2;2;5;5}"
Dim serie001s0ss3 As IXlsChartDynamicDataSourceSeries
Set serie001s0ss3 = datasource001s0.AddSerie
serie001s0ss3.SeriesTitlesFormula = "\"close\""
serie001s0ss3.DataLabelsFormula = "={\"q1\";\"q2\";\"q3\";\"q4\"}"
serie001s0ss3.SeriesValuesFormula = "={2;10;15;9}"
|
| C# code |
IXlsChart chart001s0 = worksheet.NewChart(enumChartType.charttype_stockOpenHighLowClose, row1, col1, row2, col2);
IXlsChartDynamicDataSource datasource001s0 = chart001s0.DynamicDataSource;
IXlsChartDynamicDataSourceSeries serie001s0ss0 = datasource001s0.AddSerie();
serie001s0ss0.SeriesTitlesFormula= "=\"open"";
serie001s0ss0.DataLabelsFormula = "={\"q1\";\"q2\";\"q3\";\"q4\"}";
serie001s0ss0.SeriesValuesFormula = "={5;5;6;8}";
IXlsChartDynamicDataSourceSeries serie001s0ss1 = datasource001s0.AddSerie();
serie001s0ss1.SeriesTitlesFormula = "=\"high\"";
serie001s0ss1.DataLabelsFormula = "={\"q1\";\"q2\";\"q3\";\"q4\"}";
serie001s0ss1.SeriesValuesFormula = "={15;12;15;10}";
IXlsChartDynamicDataSourceSeries serie001s0ss2 = datasource001s0.AddSerie();
serie001s0ss2.SeriesTitlesFormula = "\"low\"";
serie001s0ss2.DataLabelsFormula = "={\"q1\";\"q2\";\"q3\";\"q4\"}";
serie001s0ss2.SeriesValuesFormula = "={2;2;5;5}";
IXlsChartDynamicDataSourceSeries serie001s0ss3 = datasource001s0.AddSerie();
serie001s0ss3.SeriesTitlesFormula = "\"close\"";
serie001s0ss3.DataLabelsFormula = "={\"q1\";\"q2\";\"q3\";\"q4\"}";
serie001s0ss3.SeriesValuesFormula = "={2;10;15;9}";
|
| C/C++ code |
xlsgen::IXlsChartPtr chart001s0 = worksheet->NewChart(xlsgen::charttype_stockOpenHighLowClose, row1, col1, row2, col2);
xlsgen::IXlsChartDynamicDataSourcePtr datasource001s0 = chart001s0->DynamicDataSource;
xlsgen::IXlsChartDynamicDataSourceSeriesPtr serie001s0ss0 = datasource001s0->AddSerie();
serie001s0ss0->SeriesTitlesFormula = L"=\"open"";
serie001s0ss0->DataLabelsFormula = L"={\"q1\";\"q2\";\"q3\";\"q4\"}";
serie001s0ss0->SeriesValuesFormula = L"={5;5;6;8}";
xlsgen::IXlsChartDynamicDataSourceSeriesPtr serie001s0ss1 = datasource001s0->AddSerie();
serie001s0ss1->SeriesTitlesFormula = L"=\"high\"";
serie001s0ss1->DataLabelsFormula = L"={\"q1\";\"q2\";\"q3\";\"q4\"}";
serie001s0ss1->SeriesValuesFormula = L"={15;12;15;10}";
xlsgen::IXlsChartDynamicDataSourceSeriesPtr serie001s0ss2 = datasource001s0->AddSerie();
serie001s0ss2->SeriesTitlesFormula = L"\"low\"";
serie001s0ss2->DataLabelsFormula = L"={\"q1\";\"q2\";\"q3\";\"q4\"}";
serie001s0ss2->SeriesValuesFormula = L"={2;2;5;5}";
xlsgen::IXlsChartDynamicDataSourceSeriesPtr serie001s0ss3 = datasource001s0->AddSerie();
serie001s0ss3->SeriesTitlesFormula = L"\"close\"";
serie001s0ss3->DataLabelsFormula = L"={\"q1\";\"q2\";\"q3\";\"q4\"}";
serie001s0ss3->SeriesValuesFormula = L"={2;10;15;9}";
|
volume high low close charts are made of 4 series in the following order :
In Excel, volume high low close charts are represented by dual-axis charts : the first axis, primary, on the left, represents the volume and is shown in bars. The second axis, to the right, on a different scale, represents vertical lines for high, low and close values (with a marker for close values).

Here is how to create such a chart using xlsgen :
| Java code |
XlsChart chart001s0 = worksheet.NewChart(xlsgen.charttype_stockVolumeHighLowClose, row1, col1, row2, col2);
XlsChartDynamicDataSource datasource001s0 = chart001s0.getDynamicDataSource();
XlsChartDynamicDataSourceSeries serie001s0ss0 = datasource001s0.AddSerie();
serie001s0ss0.putSeriesTitlesFormula("=\"volume"");
serie001s0ss0.putDataLabelsFormula("={\"q1\";\"q2\";\"q3\";\"q4\"}");
serie001s0ss0.putSeriesValuesFormula("={120;130;102;120}");
XlsChartDynamicDataSourceSeries serie001s0ss1 = datasource001s0.AddSerie();
serie001s0ss1.putSeriesTitlesFormula("=\"high\"");
serie001s0ss1.putDataLabelsFormula("={\"q1\";\"q2\";\"q3\";\"q4\"}");
serie001s0ss1.putSeriesValuesFormula("={15;12;15;10}");
XlsChartDynamicDataSourceSeries serie001s0ss2 = datasource001s0.AddSerie();
serie001s0ss2.putSeriesTitlesFormula("\"low\"");
serie001s0ss2.putDataLabelsFormula("={\"q1\";\"q2\";\"q3\";\"q4\"}");
serie001s0ss2.putSeriesValuesFormula("={2;2;5;5}");
XlsChartDynamicDataSourceSeries serie001s0ss3 = datasource001s0.AddSerie();
serie001s0ss3.putSeriesTitlesFormula("\"close\"");
serie001s0ss3.putDataLabelsFormula("={\"q1\";\"q2\";\"q3\";\"q4\"}");
serie001s0ss3.putSeriesValuesFormula("={2;10;15;9}");
|
| VB code |
Dim chart001s0 As IXlsChart
Set chart001s0 = worksheet.NewChart(enumChartType.charttype_stockVolumeHighLowClose, row1, col1, row2, col2)
Dim datasource001s0 As IXlsChartDynamicDataSource
Set datasource001s0 = chart001s0.DynamicDataSource
Dim serie001s0ss0 As IXlsChartDynamicDataSourceSeries
Set serie001s0ss0 = datasource001s0.AddSerie
serie001s0ss0.SeriesTitlesFormula = "=\"volume""
serie001s0ss0.DataLabelsFormula = "={\"q1\";\"q2\";\"q3\";\"q4\"}"
serie001s0ss0.SeriesValuesFormula = "={120;130;102;120}"
Dim serie001s0ss1 As IXlsChartDynamicDataSourceSeries
Set serie001s0ss1 = datasource001s0.AddSerie
serie001s0ss1.SeriesTitlesFormula = "=\"high\""
serie001s0ss1.DataLabelsFormula = "={\"q1\";\"q2\";\"q3\";\"q4\"}"
serie001s0ss1.SeriesValuesFormula = "={15;12;15;10}"
Dim serie001s0ss2 As IXlsChartDynamicDataSourceSeries
Set serie001s0ss2 = datasource001s0.AddSerie
serie001s0ss2.SeriesTitlesFormula = "\"low\""
serie001s0ss2.DataLabelsFormula = "={\"q1\";\"q2\";\"q3\";\"q4\"}"
serie001s0ss2.SeriesValuesFormula = "={2;2;5;5}"
Dim serie001s0ss3 As IXlsChartDynamicDataSourceSeries
Set serie001s0ss3 = datasource001s0.AddSerie
serie001s0ss3.SeriesTitlesFormula = "\"close\""
serie001s0ss3.DataLabelsFormula = "={\"q1\";\"q2\";\"q3\";\"q4\"}"
serie001s0ss3.SeriesValuesFormula = "={2;10;15;9}"
|
| C# code |
IXlsChart chart001s0 = worksheet.NewChart(enumChartType.charttype_stockVolumeHighLowClose, row1, col1, row2, col2);
IXlsChartDynamicDataSource datasource001s0 = chart001s0.DynamicDataSource;
IXlsChartDynamicDataSourceSeries serie001s0ss0 = datasource001s0.AddSerie();
serie001s0ss0.SeriesTitlesFormula= "=\"volume"";
serie001s0ss0.DataLabelsFormula = "={\"q1\";\"q2\";\"q3\";\"q4\"}";
serie001s0ss0.SeriesValuesFormula = "={120;130;102;120}";
IXlsChartDynamicDataSourceSeries serie001s0ss1 = datasource001s0.AddSerie();
serie001s0ss1.SeriesTitlesFormula = "=\"high\"";
serie001s0ss1.DataLabelsFormula = "={\"q1\";\"q2\";\"q3\";\"q4\"}";
serie001s0ss1.SeriesValuesFormula = "={15;12;15;10}";
IXlsChartDynamicDataSourceSeries serie001s0ss2 = datasource001s0.AddSerie();
serie001s0ss2.SeriesTitlesFormula = "\"low\"";
serie001s0ss2.DataLabelsFormula = "={\"q1\";\"q2\";\"q3\";\"q4\"}";
serie001s0ss2.SeriesValuesFormula = "={2;2;5;5}";
IXlsChartDynamicDataSourceSeries serie001s0ss3 = datasource001s0.AddSerie();
serie001s0ss3.SeriesTitlesFormula = "\"close\"";
serie001s0ss3.DataLabelsFormula = "={\"q1\";\"q2\";\"q3\";\"q4\"}";
serie001s0ss3.SeriesValuesFormula = "={2;10;15;9}";
|
| C/C++ code |
xlsgen::IXlsChartPtr chart001s0 = worksheet->NewChart(xlsgen::charttype_stockVolumeHighLowClose, row1, col1, row2, col2);
xlsgen::IXlsChartDynamicDataSourcePtr datasource001s0 = chart001s0->DynamicDataSource;
xlsgen::IXlsChartDynamicDataSourceSeriesPtr serie001s0ss0 = datasource001s0->AddSerie();
serie001s0ss0->SeriesTitlesFormula = L"=\"volume"";
serie001s0ss0->DataLabelsFormula = L"={\"q1\";\"q2\";\"q3\";\"q4\"}";
serie001s0ss0->SeriesValuesFormula = L"={120;130;102;120}";
xlsgen::IXlsChartDynamicDataSourceSeriesPtr serie001s0ss1 = datasource001s0->AddSerie();
serie001s0ss1->SeriesTitlesFormula = L"=\"high\"";
serie001s0ss1->DataLabelsFormula = L"={\"q1\";\"q2\";\"q3\";\"q4\"}";
serie001s0ss1->SeriesValuesFormula = L"={15;12;15;10}";
xlsgen::IXlsChartDynamicDataSourceSeriesPtr serie001s0ss2 = datasource001s0->AddSerie();
serie001s0ss2->SeriesTitlesFormula = L"\"low\"";
serie001s0ss2->DataLabelsFormula = L"={\"q1\";\"q2\";\"q3\";\"q4\"}";
serie001s0ss2->SeriesValuesFormula = L"={2;2;5;5}";
xlsgen::IXlsChartDynamicDataSourceSeriesPtr serie001s0ss3 = datasource001s0->AddSerie();
serie001s0ss3->SeriesTitlesFormula = L"\"close\"";
serie001s0ss3->DataLabelsFormula = L"={\"q1\";\"q2\";\"q3\";\"q4\"}";
serie001s0ss3->SeriesValuesFormula = L"={2;10;15;9}";
|
volume open high low close charts are made of 5 series in the following order :
In Excel, volume open high low close charts are represented by dual-axis charts : the first axis, primary, on the left, represents the volume and is shown in bars. The second axis, to the right, on a different scale, represents candle sticks for open, high, low and close values (white bars when close values are higher than open values, and black otherwise).
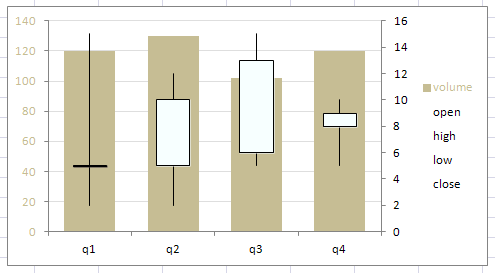
Here is how to create such a chart using xlsgen :
| Java code |
XlsChart chart001s0 = worksheet.NewChart(xlsgen.charttype_stockVolumeOpenHighLowClose, row1, col1, row2, col2);
XlsChartDynamicDataSource datasource001s0 = chart001s0.getDynamicDataSource();
XlsChartDynamicDataSourceSeries serie001s0ss0 = datasource001s0.AddSerie();
serie001s0ss0.putSeriesTitlesFormula("=\"volume"");
serie001s0ss0.putDataLabelsFormula("={\"q1\";\"q2\";\"q3\";\"q4\"}");
serie001s0ss0.putSeriesValuesFormula("={120;130;102;120}");
XlsChartDynamicDataSourceSeries serie001s0ss1 = datasource001s0.AddSerie();
serie001s0ss1.putSeriesTitlesFormula("=\"open"");
serie001s0ss1.putDataLabelsFormula("={\"q1\";\"q2\";\"q3\";\"q4\"}");
serie001s0ss1.putSeriesValuesFormula("={5;5;6;8}");
XlsChartDynamicDataSourceSeries serie001s0ss2 = datasource001s0.AddSerie();
serie001s0ss2.putSeriesTitlesFormula("=\"high\"");
serie001s0ss2.putDataLabelsFormula("={\"q1\";\"q2\";\"q3\";\"q4\"}");
serie001s0ss2.putSeriesValuesFormula("={15;12;15;10}");
XlsChartDynamicDataSourceSeries serie001s0ss3 = datasource001s0.AddSerie();
serie001s0ss3.putSeriesTitlesFormula("\"low\"");
serie001s0ss3.putDataLabelsFormula("={\"q1\";\"q2\";\"q3\";\"q4\"}");
serie001s0ss3.putSeriesValuesFormula("={2;2;5;5}");
XlsChartDynamicDataSourceSeries serie001s0ss4 = datasource001s0.AddSerie();
serie001s0ss4.putSeriesTitlesFormula("\"close\"");
serie001s0ss4.putDataLabelsFormula("={\"q1\";\"q2\";\"q3\";\"q4\"}");
serie001s0ss4.putSeriesValuesFormula("={2;10;15;9}");
|
| VB code |
Dim chart001s0 As IXlsChart
Set chart001s0 = worksheet.NewChart(enumChartType.charttype_stockVolumeOpenHighLowClose, row1, col1, row2, col2)
Dim datasource001s0 As IXlsChartDynamicDataSource
Set datasource001s0 = chart001s0.DynamicDataSource
Dim serie001s0ss0 As IXlsChartDynamicDataSourceSeries
Set serie001s0ss0 = datasource001s0.AddSerie
serie001s0ss0.SeriesTitlesFormula = "=\"volume""
serie001s0ss0.DataLabelsFormula = "={\"q1\";\"q2\";\"q3\";\"q4\"}"
serie001s0ss0.SeriesValuesFormula = "={120;130;102;120}"
Dim serie001s0ss1 As IXlsChartDynamicDataSourceSeries
Set serie001s0ss1 = datasource001s0.AddSerie
serie001s0ss1.SeriesTitlesFormula = "=\"open""
serie001s0ss1.DataLabelsFormula = "={\"q1\";\"q2\";\"q3\";\"q4\"}"
serie001s0ss1.SeriesValuesFormula = "={5;5;6;8}"
Dim serie001s0ss2 As IXlsChartDynamicDataSourceSeries
Set serie001s0ss2 = datasource001s0.AddSerie
serie001s0ss2.SeriesTitlesFormula = "=\"high\""
serie001s0ss2.DataLabelsFormula = "={\"q1\";\"q2\";\"q3\";\"q4\"}"
serie001s0ss2.SeriesValuesFormula = "={15;12;15;10}"
Dim serie001s0ss3 As IXlsChartDynamicDataSourceSeries
Set serie001s0ss3 = datasource001s0.AddSerie
serie001s0ss3.SeriesTitlesFormula = "\"low\""
serie001s0ss3.DataLabelsFormula = "={\"q1\";\"q2\";\"q3\";\"q4\"}"
serie001s0ss3.SeriesValuesFormula = "={2;2;5;5}"
Dim serie001s0ss4 As IXlsChartDynamicDataSourceSeries
Set serie001s0ss4 = datasource001s0.AddSerie
serie001s0ss4.SeriesTitlesFormula = "\"close\""
serie001s0ss4.DataLabelsFormula = "={\"q1\";\"q2\";\"q3\";\"q4\"}"
serie001s0ss4.SeriesValuesFormula = "={2;10;15;9}"
|
| C# code |
IXlsChart chart001s0 = worksheet.NewChart(enumChartType.charttype_stockVolumeOpenHighLowClose, row1, col1, row2, col2);
IXlsChartDynamicDataSource datasource001s0 = chart001s0.DynamicDataSource;
IXlsChartDynamicDataSourceSeries serie001s0ss0 = datasource001s0.AddSerie();
serie001s0ss0.SeriesTitlesFormula= "=\"volume"";
serie001s0ss0.DataLabelsFormula = "={\"q1\";\"q2\";\"q3\";\"q4\"}";
serie001s0ss0.SeriesValuesFormula = "={120;130;102;120}";
IXlsChartDynamicDataSourceSeries serie001s0ss1 = datasource001s0.AddSerie();
serie001s0ss1.SeriesTitlesFormula= "=\"open"";
serie001s0ss1.DataLabelsFormula = "={\"q1\";\"q2\";\"q3\";\"q4\"}";
serie001s0ss1.SeriesValuesFormula = "={5;5;6;8}";
IXlsChartDynamicDataSourceSeries serie001s0ss2 = datasource001s0.AddSerie();
serie001s0ss2.SeriesTitlesFormula = "=\"high\"";
serie001s0ss2.DataLabelsFormula = "={\"q1\";\"q2\";\"q3\";\"q4\"}";
serie001s0ss2.SeriesValuesFormula = "={15;12;15;10}";
IXlsChartDynamicDataSourceSeries serie001s0ss3 = datasource001s0.AddSerie();
serie001s0ss3.SeriesTitlesFormula = "\"low\"";
serie001s0ss3.DataLabelsFormula = "={\"q1\";\"q2\";\"q3\";\"q4\"}";
serie001s0ss3.SeriesValuesFormula = "={2;2;5;5}";
IXlsChartDynamicDataSourceSeries serie001s0ss4 = datasource001s0.AddSerie();
serie001s0ss4.SeriesTitlesFormula = "\"close\"";
serie001s0ss4.DataLabelsFormula = "={\"q1\";\"q2\";\"q3\";\"q4\"}";
serie001s0ss4.SeriesValuesFormula = "={2;10;15;9}";
|
| C/C++ code |
xlsgen::IXlsChartPtr chart001s0 = worksheet->NewChart(xlsgen::charttype_stockVolumeOpenHighLowClose, row1, col1, row2, col2);
xlsgen::IXlsChartDynamicDataSourcePtr datasource001s0 = chart001s0->DynamicDataSource;
xlsgen::IXlsChartDynamicDataSourceSeriesPtr serie001s0ss0 = datasource001s0->AddSerie();
serie001s0ss0->SeriesTitlesFormula = L"=\"volume"";
serie001s0ss0->DataLabelsFormula = L"={\"q1\";\"q2\";\"q3\";\"q4\"}";
serie001s0ss0->SeriesValuesFormula = L"={120;130;102;120}";
xlsgen::IXlsChartDynamicDataSourceSeriesPtr serie001s0ss1 = datasource001s0->AddSerie();
serie001s0ss1->SeriesTitlesFormula = L"=\"open"";
serie001s0ss1->DataLabelsFormula = L"={\"q1\";\"q2\";\"q3\";\"q4\"}";
serie001s0ss1->SeriesValuesFormula = L"={5;5;6;8}";
xlsgen::IXlsChartDynamicDataSourceSeriesPtr serie001s0ss2 = datasource001s0->AddSerie();
serie001s0ss2->SeriesTitlesFormula = L"=\"high\"";
serie001s0ss2->DataLabelsFormula = L"={\"q1\";\"q2\";\"q3\";\"q4\"}";
serie001s0ss2->SeriesValuesFormula = L"={15;12;15;10}";
xlsgen::IXlsChartDynamicDataSourceSeriesPtr serie001s0ss3 = datasource001s0->AddSerie();
serie001s0ss3->SeriesTitlesFormula = L"\"low\"";
serie001s0ss3->DataLabelsFormula = L"={\"q1\";\"q2\";\"q3\";\"q4\"}";
serie001s0ss3->SeriesValuesFormula = L"={2;2;5;5}";
xlsgen::IXlsChartDynamicDataSourceSeriesPtr serie001s0ss4 = datasource001s0->AddSerie();
serie001s0ss4->SeriesTitlesFormula = L"\"close\"";
serie001s0ss4->DataLabelsFormula = L"={\"q1\";\"q2\";\"q3\";\"q4\"}";
serie001s0ss4->SeriesValuesFormula = L"={2;10;15;9}";
|

More information can be found here.
More information can be found here.
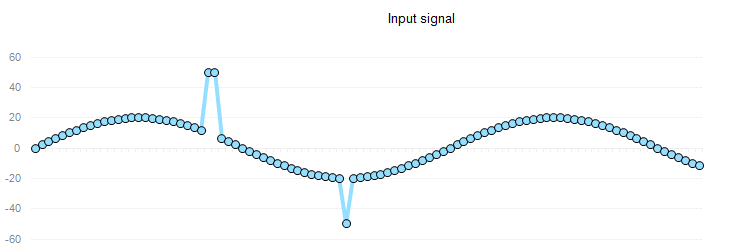

More information can be found here.

More information can be found here.
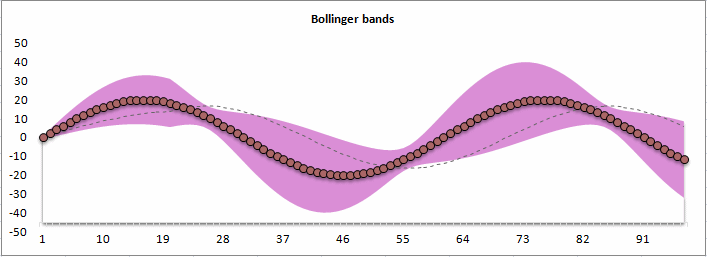
More information can be found here.
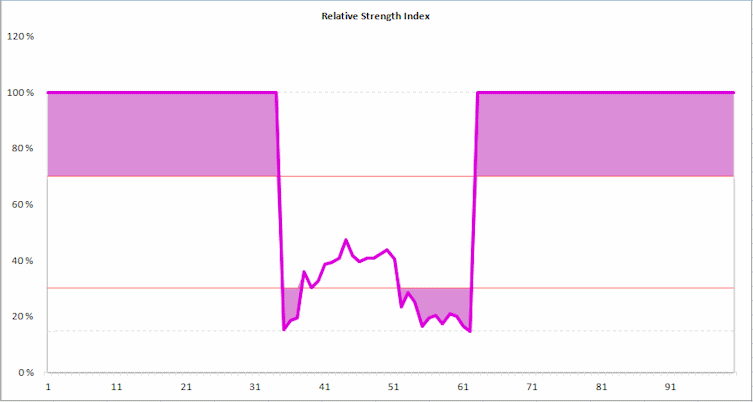
More information can be found here.

The Lorenz curve (named after Max Lorenz) represents the dispersion of inequalities, usually income, but not only. Wikipedia article.
Points on the Lorenz curve represent statements like "the bottom 20% of all households have 10% of the total income.". A perfectly equal income distribution would be one in which every person has the same income (ideal curve displayed for comparison purposes). The Lorenz curve is always below the ideal curve.
The data points on the horizontal axis shows the cumulated population and the data points on the vertical axis shows the cumulated income (or any other measure).
The chart example above is made from the following data :
| Population | % Population | % Cumulated Population | Income | % Income | % Cumulated Income | |
| South | 43062 | 36.87% | 36.87% | 47961 | 34.06% | 34.06% |
| Midwest | 26266 | 22.49% | 59.36% | 52209 | 22.62% | 56.68% |
| Northeast | 21351 | 18.28% | 77.65% | 54283 | 19.12% | 75.80% |
| West | 26105 | 22.35% | 100.00% | 56218 | 24.20% | 100.00% |
The Lorenz curve can be created from just raw Population and Income data, as is found in public files (government). xlsgen orders the data, computes cumuls and draws the line.
| C/C++ code |
xlsgen::IXlsChartPtr chart1 = worksheet->NewChart(xlsgen::charttype_lorenzcurve, row1, col1, row2, col2);
xlsgen::IXlsChartDynamicDataSourceSeriesPtr serie1 = chart1->DynamicDataSource->AddSerie();
serie1->DataLabelsFormula = L"={43062;26266;21351;26105}";
serie1->SeriesValuesFormula = L"={47961;52209;54283;56218}";
|
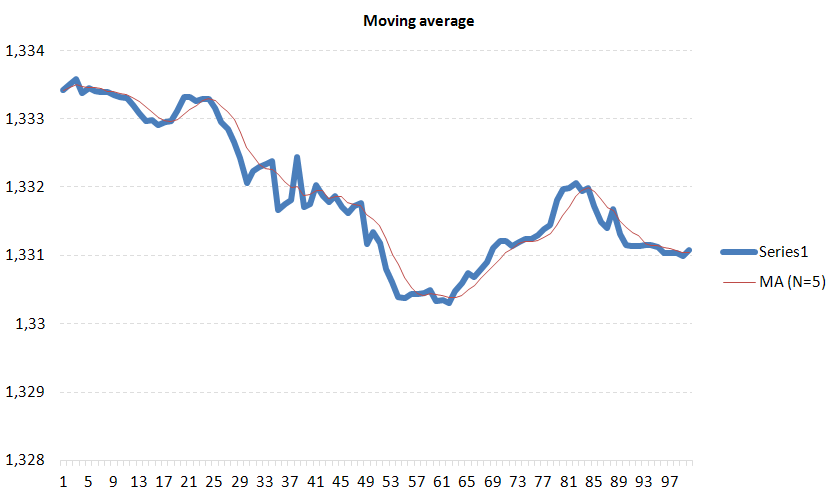
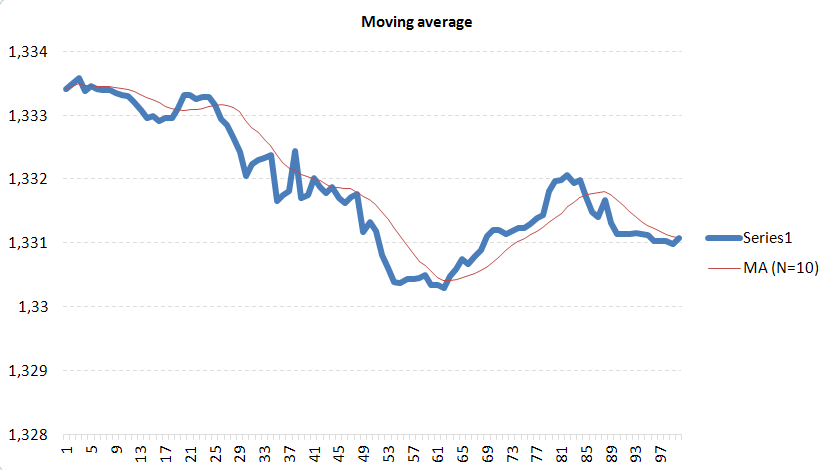
A moving average chart is a chart where a mathematical figure called average is calculated over time, resulting in a curve in and of itself. A moving average, by its nature, smooths out spikes, making it easier to see trends. This chart is often used in financial trading as a tool for analysis.
The average calculation only takes a fraction, usually small, of past data, a parameter which is called N, which is why the chart is called moving average. By default, N=20, meaning that the point in that curve is defined by 20 older data points. The average, because it smoothens a signal, carries a late effect, which is obvious visually, which grows with the value of N. By opposite, the smaller N is, the tighter the average is to the data signal.
Below are examples of the moving average with two other values of N, respectively 10 and 40.

| C/C++ code |
xlsgen::IXlsWorkbookPtr wbk = engine->Open( L"EURUSD1.csv", L"output.xls" ); xlsgen::IXlsChartPtr chart1 = wbk->WorksheetByIndex[1]->NewChart(xlsgen::charttype_movingaverage, row1, col1, row2, col2); xlsgen::IXlsChartDynamicDataSourceSeriesPtr serie1 = chart1->DynamicDataSource->AddSerie(); serie1->SeriesValuesFormula = L"=R1C3:R100C3"; chart1->SeriesByIndex[1]->DataWindowSelection = 40; // N=40 |
The DataWindowSelection property is available in each series of data in order to customize the value of N.

More information here.
The MACD chart (short for Moving average convergence divergence) is a trend chart often used for stock trading. It is made of two lines and one bar. Wikipedia article.

The first line is the signal line and is a two pass filter. Its scale is represented on the secondary Y axis. The second line, the average line, is a low pass filter of the signal line. And finally the bar chart is the difference between the two. Both are attached to the secondary Y axis.
Interpretation for trading :
| C/C++ code |
xlsgen::IXlsWorkbookPtr wbk = engine->Open( L"EURUSD1.csv", L"output.xls" ); xlsgen::IXlsChartPtr chart1 = wbk->WorksheetByIndex[1]->NewChart(xlsgen::charttype_macd, row1, col1, row2, col2); xlsgen::IXlsChartDynamicDataSourceSeriesPtr serie1 = chart1->DynamicDataSource->AddSerie(); serie1->SeriesValuesFormula = L"=R1C3:R100C3"; |
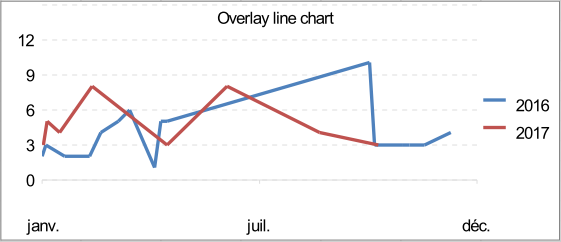
The overlay line chart makes it possible to, as the name implies, overlay more than one time series one on top of another.
What's of interest is that whenever a data series spans across multiple years, this chart splits it into multiple series, one per year, sorts the data points according to the timeline, and makes it possible to overlay the series on the same chart in order to compare time periods year over year. xlsgen hides the complexity of this : this chart cannot be built in Excel without a number of step calculations and sorting that xlsgen does.
| C/C++ code |
xlsgen::IXlsWorkbookPtr wbk = engine->Open( L"EURUSD1.csv", L"output.xls" ); xlsgen::IXlsChartPtr chart1 = wbk->WorksheetByIndex[1]->NewChart(xlsgen::charttype_overlayline, row1, col1, row2, col2); xlsgen::IXlsChartDynamicDataSourceSeriesPtr serie1 = chart1->DynamicDataSource->AddSerie(); serie1->SeriesValuesFormula = L"=R1C3:R100C3"; |
xlsgen documentation. © ARsT Design all rights reserved.